Less than $5 Homeschool Graphing Activities (by price, high to low)

5.OA.3 BUNDLE! Numerical Patterns Worksheets, Task Cards, Exit Ticket, and Quiz
By Fifth Grade Mathematicians
Looking for a fun way to help your students master 5.OA.3- Numerical Patterns? Look no further! This bundle has everything you need to help your students be successful in mastering Numerical Patterns concepts.
What's included:
- 4 practice worksheets
- 24 Task Cards (printable and Google Form version)
- Exit ticket (printable for journals)
- 10 question quick check assessment (printable and Google Form version)
Please see my store for other popular resources!
- 5th Grade Math Spiral EOG Review Task Card Bundle
- Spiral EOG Review Worksheets- All 5th Grade Standards
- 5th Grade Fractions Unit Bundle! All Fraction Standards

Thanksgiving/Fall 3rd Grade Graphs: Bar Graphs, Pictographs, Line Plots: No Prep
By E•Fish•ient Teaching
Get festive this fall with these fun Thanksgiving/Fall skill-building bundle of graphs! This graphing bundle is pack full of fun and engaging activities to help your students grasp essential graphing skills. Each bar graph, pictograph, and line plot is aligned with the 3rd grade core, but can be used with many elementary students ages. Each graph type features two activities: one for analyzing pre-made data and one for creating their own graphs usually surveying their own classmates. These Fall graphs will give students valuable hands-on practice and critical thinking opportunities.
What's Included?
- Line Plots (2 Activities)
- Analyze the Data: A Thanksgiving-themed line plot where students interpret and answer questions about data related to the holiday line plot.
- Create Your Own: Students measure Fall items to the nearest quarter inch and create their own line plot, reinforcing measurement skills and data representation.
2. Bar Graphs (2 Activities)
- Analyze the Data: Students read and interpret data on a pre-made Thanksgiving bar graph, answering questions that help them identify data and make comparisons.
- Create Your Own: Students collect class data, such as favorite Thanksgiving food, and build their own bar graph, practicing data collection, organization, and display.
3. Pictographs (2 Activities)
- Analyze the Data: Students study a Thanksgiving pictograph and answer questions about the information presented, developing their ability to read and interpret pictographs.
- Create Your Own: Students are given data and have to represent it with Thanksgiving-themed icons to create a personalized pictograph, enhancing their creativity and data skills.
4. Teacher’s Guide & Answer Key:
- This bundle includes a teacher’s guide with instructions and answer keys, making it easy to implement and adapt for diverse learners.
Perfect for the month of November! Use these graphs for math center, whole class instruction, homework, or individual practice. Each graph will keep students engaged while building their confidence with graphs. Give your students the practice they need with these bar graphs, pictographs, and line plots.
Features:
- Ready to Use: These no prep graphs are ready to print and use. If you are in a pinch for time, just grab these engaging graphs for your classroom use. ***The line plot activity will need students to have a ruler.***
- Hands-On Learning Activities: Spark curiosity and promote active learning with this collection of hands-on math activities. Whether students are collecting data, creating their own graphs, or analyzing trends, these activities provide valuable opportunities for students to apply their math skills in real-world contexts.
- Measurement to the Quarter Inch: Students will create their own line plot while practicing measurement to the quarter inch.
- Aligned with the Core Standards: This graphing bundle is aligned with 3rd-grade math standards, ensuring that students build essential math skills while exploring seasonal themes.
- Easy Integration: Seamlessly incorporate the graphs and activities into your math lessons, centers, and assessments to enhance student understanding and engagement.
Looking for other holiday graphs? Check these out:
- Holiday/Christmas Graphs
- Winter/January Graphs
- Valentine's Day Graphs
If you enjoyed this product, please leave a review and follow my store. If you would like to see more products by me follow the link Finding the Fish. Thank you for your purchase and I hope you enjoy!

Halloween Math Count & Graph : I Spy Fun from 1 to 10
By Create Learn Inspire Grow
Dive into the festive spirit with "Halloween Math Count & Graph: I Spy Fun from 1 to 10"! This engaging bundle combines counting and graphing activities with a spooky twist. Perfect for young learners, it encourages hands-on practice as they explore Halloween-themed visuals while counting and identifying objects from 1 to 10. Ideal for classrooms or at-home learning, this resource makes math fun and festive!
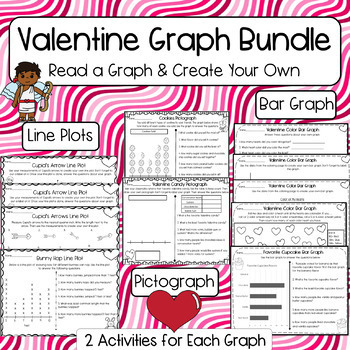
Valentine's Day Graph Bundle: Bar Graph, Line Plot, Pictograph: Measurement
By E•Fish•ient Teaching
This is the perfect graphing bundle for Valentine's Day or February. Each graph has 2 different activities.
Bar Graph: Students will interpret data on a graph about cupcakes. The second bar graph, students will roll a dice and color in the different hearts on the page. Then they will graph the colors of the hearts and answer questions about their graph.
Line Plots: Students will interpret data and answer questions about the different distance bunnies hop. The second line plot, students will measure cupid's arrows to the nearest quarter inch and then graph their findings on the line plot.
Pictograph: Students will interpret data on a pictograph about cookies. The second pictograph, students will survey their classmates to see what their favorite Valentine candy is. Then they will have to answer questions about their pictograph.
6 different graphs with some differentiation on the create your own graphs. There are some graphs with some labels and others that have no labels and the students will have to create their graph from scratch.
If you enjoyed this product, please leave a review and follow my store. If you would like to see more products by me follow the link Finding the Fish. Thank you for your purchase and I hope you enjoy!
Graphing Templates in Spanish!! Encuestas, Gráficos y Frecuencias.
By La Llama Bilingüe
This resource includes 18 graphing templates in Spanish.
- 1 blank survey template.
- 4 survey templates with choices.
- 4 survey templates with prewritten sentences (kids add key information).
- 2 candy graphing templates (color and BW)
- 1 linking blocks graphing template
- 6 probability (frequency) graphing templates: 3D shapes, food, sports, coins (Canada and USA), and 1 blank.
Just Print and Go!
Team Target Review: Linear Functions Group Review Activity Grade 8
By EZMath
Ever needed a review activity on writing and graphing linear functions for 8th grade that was fun and engaging for your students? Team Target Review is a cooperative and competitive activity designed to get students thinking, talking, and working together.
Teams of 2-4 students work together to complete increasing levels of difficulty on linear functions. As students progress, you can quickly assess mastery and give intervention help on the spot.
This activity works great as an engaging review session before an assessment, a quick(ish) activity on one of those pesky minimum days where you have limited time, or as part of a block period when you want to break up the direct instruction.
This activity includes:
-Suggested activity instructions (based on how I run this in my classroom).
-6 rounds with 4 problems each of targeted review on linear functions for 8th grade.
-Complete worked out solutions for all 6 rounds.
If you enjoy this activity you might also like my other Team Target Review activities, or check out my Level Up products, which provide students increasing levels of challenge they can do at their own pace.
Check out my blog at EZMathBlog or follow me on Twitter, Instagram, or Threads.
Graphing, Frequency and Tallying Templates!
By La Llama Bilingüe
This resource includes 18 graphing templates.
- 1 blank survey template.
- 4 survey templates with choices.
- 4 survey templates with prewritten sentences (kids add key information).
- 2 candy graphing templates (color and BW)
- 1 linking blocks graphing template
- 6 probability (frequency) graphing templates: 3D shapes, food, sports, coins (Canada and USA), and 1 blank.
Just Print and Go!
Real-Life fun activity with Math! The Coordinate Plane- A Fun Application
By Daniel
It is always a good strategy to review essential skills with your students, and this is right up there with the most essential!
In this fun, real-life exercise, students learn about the growth of large pumpkins in the Washington County Fair Pumpkin Competition. Students will use and improve the following skills:
- Plotting points on the coordinate plane
- Finding the y-value when given the x-value and visa versa
- Finding the relationship (equation) between two variables.
- Real-life problem-solving
- Completing the data in a table from a given graph.
- Extrapolating from given data and making predictions.
You might also not want to miss out on the other resources in the Coordinate Plane Series!
If you enjoyed this resource, please leave a REVIEW at your leisure, for other possible buyers to know how you have experienced it. Thank you so much!
Please follow my store here to get notified of all new resources I create.
I love to improve my resources, so any constructive feedback from you will be extremely welcome.
Enjoy this resource.
Graphing Systems of Equations Differentiated Review Activity| Grade 8 Math
By EZMath
Level Ups are a fun way to challenge your students to complete various levels of mastery on graphing systems of equations. Aligned to the common core standards, Level Ups provide 5 levels of challenge for your students to complete, starting with pre-requisite graphing skills all the way up to creating and graphing systems of equations from context.
Students start at level zero and work their way up to level 4, giving them accurate feedback on what they have mastered, and what they still need to work on. This lesson works as a great way to review graphing systems of equations after teaching the concept, or as preparation for an upcoming assessment.
This activity includes:
- Suggested activity instructions (based on how I run this in my classroom).
- Five levels with 4-6 questions (level 4 has one challenging word problem and graph).
- Complete worked out solutions for each level.
If you enjoy this activity, please check out my other Level Up products, or my Team Target Review series, which encourages group work and rich math discussion.
Check out my blog at EZMathBlog or follow me on Twitter, Instagram, or Threads.
Graphing Linear Functions Differentiated Review Activity | Grade 8 Math
By EZMath
Level Ups are a fun way for your students to practice or review graphing linear functions in both slope-intercept form and standard form. Aligned to the common core standards, this Level Ups activity includes 5 differentiated tasks that increase in rigor. The task cards begin with pre-requisite skills involving proportional relationships and the basics of slope and y-intercept, then "level up" all the way to creating an appropriately scaled graph for a given linear function scenario.
Students start at level zero and work their way up to level 4, giving them accurate feedback on what they have mastered, and what they still need to work on. This lesson works as a great way to review what is and is not a function, or as preparation for an upcoming assessment.
This activity includes:
- Suggested activity instructions (based on how I run this in my classroom).
- Five levels with 6 - 8 questions each.
- The final level includes 2 word problems where students must scale their own graph based on the domain and range of the scenario.
- Complete answer keys for each level.
My students love "Level Up Day" in my own classroom, and the activity works great as independent practice, a pairs activity, or even group work. I also use this when I need a majority of students working independently while I pull a small group for intervention.
If you enjoy this activity, please check out my other Level Up products, or my Team Target Review series, which encourages group work and rich math discussion.
Check out my blog at EZMathBlog or follow me on Twitter, Instagram, or Threads.
Olympic Games math!Data and Statistics - Examining the Women's 800M World Record
By Daniel
The Olympic games have gone, so how much fun would it be to study and predict possible World records of the future?
Real-Life Data and Statistics is the most interesting for students. In this fun, DIY Task, (with complete key), students study the women's 800 Meters world record from 1922 tot 2021. They have to
- plot the data on the coordinate plane
- draw a bar graph of the data
- calculate the rate of improvement from one record to the next
- voice their opinion (backed up with facts) on which record was the best.
Also make sure that you include these next 2 products, as they also relate to the World Athletic Games!
If you enjoyed this resource, please leave a REVIEW at your leisure, for other possible buyers to know how you have experienced it. Thank you so much!
Please follow my store here to get notified of all new resources I create.
I love to improve my resources, so any constructive feedback from you will be extremely welcome.
Enjoy this resource.
Proportional Relationships Differentiated Review Activity | Grade 8 Math
By EZMath
Level Ups are a fun way to challenge your students to complete various levels of mastery on working with proportional relationships. Aligned to the common core standards, this Level Ups activity provides 4 levels of challenge for your students to complete, starting with pre-requisite proportional relationship skills such as identifying when a relationship is or is not proportional all the way up to comparing units rate from different representations.
Students start at level zero and work their way up to level 3, giving them accurate feedback on what they have mastered, and what they still need to work on. This lesson works as a great way to review comparing proportional relationships after teaching the concepts, or as preparation for an upcoming assessment.
This activity includes:
- Suggested activity instructions (based on how I run this in my classroom).
- Four levels with 4 - 6 questions each.
- Complete answer keys for each level.
If you enjoy this activity, please check out my other Level Up products, or my Team Target Review series, which encourages group work and rich math discussion.
Check out my blog at EZMathBlog or follow me on Twitter, Instagram, or Threads.
Olympic Games! Data and Statistics - Examining the 400M Hurdles World Record
By Daniel
The Olympic Games have finished, and a perfect time to get your kids interested in how records are met and predicted.
Real-Life Data and Statistics is most interesting for students. In this fun, DIY Task, (with complete key), students study the men's 400M hurdles world record from 1908 tot 2021. They have to
- plot the data on the coordinate plane
- draw a bar graph of the data
- calculate the rate of improvement from one record to the next
- voice their opinion (backed up with facts) on which record was the best.
You might also not want to miss out on these resources in the Series on the Olympic Games!
If you enjoyed this resource, please leave a REVIEW at your leisure, for other possible buyers to know how you have experienced it. Thank you so much!
Please follow my store here to get notified of all new resources I create.
I love to improve my resources, so any constructive feedback from you will be extremely welcome.
Enjoy this resource.

St. Patrick's Day & March Graphs: Bar Graphs, Pictographs, & Line Plots
By E•Fish•ient Teaching
Looking for a pot of gold at the end of your graphing unit? Grab this lucky graphing bundle perfect for the month of March and the St. Patrick's Day holiday. This graphing bundle includes themed bar graphs, pictographs, and line plots that will be perfect for your 3rd grade classroom. Each type of graph includes at least 2 graphs for practice. This bundle has a total of 8 graphs for your use. The line plot incorporates another 3rd grade standard of mearsuring items to the nearest quarter inch. Engage your young learners in hands-on data exploration while celebrating the festive spirit of the season.
Features:
- Ready To Use: These no prep graphs are ready to print and use. If you are in a pinch for time, just grab these engaging graphs for your classroom use.
- Themed Practice: From leprechauns and shamrocks to springtime growth and seasonal weather patterns, these visuals bring math to life in a fun and engaging way. Each bar graph, pictograph, and line plot is perfectly themed for the month of March.
- Hands-On Learning Activities: Spark curiosity and promote active learning with this collection of hands-on math activities. Whether students are collecting data, creating their own graphs, or analyzing trends, these activities provide valuable opportunities for students to apply their math skills in real-world contexts.
Why choose this graphing bundle?
- Engaging and Relevant: Capture students' interest with these themed graphs.
- Aligned with Curriculum Standards: This graphing bundle is aligned with 3rd-grade math standards, ensuring that students build essential math skills while exploring seasonal themes.
- Easy Integration: Seamlessly incorporate the graphs and activities into your math lessons, centers, and assessments to enhance student understanding and engagement.
What you'll get...
- 4 Bar Graphs- 2 Create your own bar graphs, 1 read the data, & 1 extension bar graph for differentiation with higher learners.
- 2 Pictographs- 1 create your own graph by surveying students in the classroom, 1 read the data & answer questions
- 2 Line Plots- 1 create your own line plot by measuring rainbows to the nearest quarter inch, 1 read the data & answer questions
Inspire curiosity, ignite a passion for math, and empower your students to become confident data analysts with themed activities and graphs that make math fun! Get this St. Patrick's Day & March Graphs today and watch your students' math skills bloom like spring flowers!
I hope you enjoyed this product! If you liked it, please leave me a review. If you would like to see some of my other products please follow along at Finding The Fish.
Christmas Math Activities Graphing Worksheets Spin Count and Graph
By Primary Piglets
Christmas Graphing! Math Centers! Spin and Graph!
These CHRISTMAS TOYS themed GRAPHING WORKSHEETS help students practice with Bar Graphs. You get SPIN & GRAPH and COUNT TALLY & GRAPH worksheets.
Perfect graphing practice for Primary Grades, just PRINT & GO!
✅Save money and get the BUNDLE at great savings!
HOW TO USE
- Morning Work Stations
- Substitute Plans
- Independent work
- Math Centers, Math Stations
WHAT'S INCLUDED
CHRISTMAS TOYS GRAPHING WORKSHEETS
- 4 Spin & Graph pages
- 4 Count Tally & Graph pages
✅Grab yourself some $1 DOLLAR DEALS!
✅Grab yourself some $2 DOLLAR DEALS!
12 Days of Christmas Math Activities Graphing Worksheets Spin Count and Graph
By Primary Piglets
JUST PRINT & GO with this fabulous set of THE 12 DAYS OF CHRISTMAS graphing worksheets! These graphing activities are just what you need for your Kindergarten, 1st or 2nd grade students! These no prep printables are perfect for morning work, math lessons or centers. They are fun, engaging and cover a variety of graphing practice; organize data, represent data & interpret data!
✅Click here the DECEMBER GRAPHING bundle at great savings!
✅Grab yourself some $1 DOLLAR DEALS!
✅Grab yourself some $2 DOLLAR DEALS!
DOWNLOAD INCLUDES
⭐4 Count Tally & Graph pages
⭐4 Spin & Graph with questions
⭐4 Spin & Graph open ended
SIMPILFY YOUR TEACHING LIFE...
❤️ Morning Work
❤️ Print & Go Centers
❤️ Engaging for Fast Finishers
❤️ Substitutes, grab & go
✅Click here for more GRAPHING activities!
✅ Click here for a YEAR LONG ADDITION & SUBTRACTION color by number bundle at great savings!
Enjoy! Thanks for your business!
Deb @ Primary Piglets

Holiday/Christmas Graphing: Bar Graphs, Pictographs, Line Plots: Read & Create
By E•Fish•ient Teaching
Bar graphs, pictographs, and line plots Oh My! The perfect holiday/Christmas graphing bundle. These ready to print and use graphs are great for the month of December. There are line plots, bar graphs, and pictographs. Students will practice reading the graphs and answering questions. Then each graph students will be able to gather their own data by asking classmates or counting objects. Then they will take their data they collected and graph their findings. This is a perfect review or introduction to bar graphs, pictograph, and line plots. There are 6 pages of practice.
What's Included:
- 2 Line Plots
- 2 Bar Graphs
- 2 Pictographs
- Answer Keys
Each graph has one graph where you read and interpret the data given on the worksheet. The second graph requires students to create their own graph, by asking classmates questions, measuring things, etc. This allows the students to practice labeling graphs and creating their own.
What people are saying:
Sabrina R was very satisfied saying, "Great resource during the holidays, after we studied graphs."
Interested in more products like this? Check out these...
Valentine's Graphing Bundle
Winter Graphing
Holiday Research Project
If you enjoyed this product, please leave a review and follow my store. If you would like to see more products by me follow the link Finding the Fish. Thank you for your purchase and I hope you enjoy!
Graphs & Data Math Curriculum (Bar, Line, Box-N-Whiskers, and MORE!!)
By Reece's Tech Shop by Scott Reece
This Graphing and Data Unit gives you a way to assess how well your students have learned graphs. The Data Depot is a real-world exercise in studying data and using graphs to interpret that data. Students will create various graphs as they look at sales data from a local store. Creating graphs! Interpreting data! It's all here!!
The student packet includes:
-Mean, Median, Mode
-Line Plots
-Box & Whiskers
-Frequency Tables
-Stem-N-Leaf
-Bar Graphs
-Line Graphs
-Venn Diagrams
-Reflection Page
Submit your feedback to earn TeachShare credit!
Did you know that if you go to your “My Purchases” page, there is a “Provide Feedback” link? Click it to be taken to a page where you can give a quick rating and leave a short comment for the product. Every time you give feedback, TeachShare gives you credit that you may use to lower the cost of future purchases!
Back To School Graphing: Line Plots, Pictographs, & Bar Graphs: Create & Read
By E•Fish•ient Teaching
It's time for back to school! Welcome a new school year with these Back To School Graphs resource! This versatile set includes 6 ready to use graphs designed to make learning about data both fun and educational. Each line plot, bar graph, and pictograph will keep students engaged and will provide hands-on practice. These graphs are also great for getting students talking to each other and getting to know each other a little better. A perfect ice breaker while they learn!
What's Included?
- 2 Pictographs
- 2 Line Plots
- 2 Bar Graphs
- Answer Keys
Each type of graph (pictograph, line plot, & bar graph) has 2 separate worksheet practices. One graph is where students will read and interpret data given on the graph. The second graph requires students to create their own graph by collecting data from classmates. This allows the students to practice creating their own graph and correctly labeling each graph.
Features:
Engaging & Age Appropriate: Tailored for elementary students, these worksheets are designed to be engaging and easy to understand, making graphing an enjoyable experience.
Printable & Easy to Use: Simply print each worksheet and you're ready to go. Ideal for classroom use, homework assignments, centers, or individual practice.
Versatile Use: Perfect for reinforcing math skills during back to school season, but can be used anytime during the year. The themes of each graph just focus closely with back to school ideas.
Benefits:
- Enhances Data Interpretation Skills: Students will improve their ability to interpret and create different types of graphs, an essential skill in math and everyday life.
- Builds Confidence: Engaging activities helping build students' confidence in their graphing abilities and hopefully in their social skills as they get to talk with classmates to gather their own data.
Kick off the school year with an engaging graph that gets students moving, talking, and graphing.
Looking for other graphing activities to add to your classroom? Take a look at these resources.
- Holiday Graphing
- Thanksgiving Graphing
- Spring/Easter Graphing
- Winter/January Graphing
If you enjoyed this product, please leave a review and follow my store. If you would like to see more products by me follow the link E•Fish•ient Teaching. Thank you for your purchase and I hope you enjoy!
3rd Grade Math Review Scavenger Hunt: Polygons, Area, Rounding, and More
By E•Fish•ient Teaching
This is the perfect review of their 3rd grade math skills. They get to apply what they learned to the world around them. This would be ideal for the end of 3rd grade year for students to show what they have learned. Students will get to apply what they learned to their surroundings. This fun scavenger hunt has students walk around the school/playground and practice their math skills. They get to find real life math applications by finding arrays around them. Looking for symmetrical objects or finding the area of something on their playground or classroom. This is a hands on activity where each student can go at their own pace and explore their learning their own way. So many skills are practiced as students will make graphs, find polygons, find area, and so much more.
End the year with a bang and a fun review of their math skills. Or begin the 4th grade year with a fun review of the math skills they learned from 3rd grade.
What's Included:
- A page for each of the following math skills fractions, elapsed time, arrays, symmetry, area, bar graphs, polygons, rounding, angles, area, line plot, word problems, pictograph, and addition.
This is a fun end of the year independent booklet to show what they know about 3rd grade math.
What other teachers are saying:
⭐️⭐️⭐️⭐️⭐️Emily V says, "This fun get up and move scavenger hunt got even my most reluctant students excited about math class--this is definitely a keeper! Thank you so much!"
⭐️⭐️⭐️⭐️⭐️Just Another Smith says, "This resource was exactly what I needed for my class! I know that it says "end of year" but it really can be used at other times. I found it to be the perfect "no-prep" resource to review our math standards. My students enjoyed the activities and they even asked if we had more activities to add to the book. It was simple, easy to put together, and thoughtfully created with the actual math standards in mind. I will be buying more resources from this store!"
⭐️⭐️⭐️⭐️⭐️June says, "What a great way to get kids excited about learning through movement. So much more fun than seat work. The kids loved applying what they had learned in such an active way."
Please feel free to look at the rest of my store at and if you loved my product please leave a review! Thank you!
https://www.TeachShare.com/Sellers-Im-Following/Add/Finding-The-Fish.