Less than $5 Elementary School Graphing Resources (by price, high to low)
3rd Grade Fun End of Year Math Review Test Prep Game Show No Prep Math Game
By That One Cheerful Classroom
Struggling to find a fun way to practice and review math skills with your 3rd grade students? This fun, interactive, game show style end of the year math review game will have your students begging for more activities just like it! Get ready for math prep with the exciting, easy-to-use Review Math Game Show.
Please click on the PREVIEW button above to see how the game works!
This math review activity is super fun and engaging for students and EASY for busy teachers to use. With NO PREP needed, you'll be set to review important 3rd grade math skills in no time at all!
There are 25 questions at different point values that students can choose from. When they click on any question button, a question appears. Students solve and then you can check answers with the whole class by clicking on the "ANSWER" button.
This engaging 3rd Grade End of the Year Math Review Game Show includes:
- Teacher’s Guide & Directions
- 25 Math Review Question Slides
- 5 Measurement & Data
- 5 Operations
- 5 Base Ten
- 5 Fractions
- 5 Geometry
- 25 Math Review Answer Slides
- Digital, Interactive PowerPoint
There are several ways this game can be used:
- Whole Group Instruction/Review – Display PowerPoint on Smartboard or classroom screen.
- Remote Learning – Share the PowerPoint on your screen with your students.
- Learning Centers – Set up the PowerPoint on a computer or device for students in the center.
Prep is quick and easy... All the hard work is done for you! Just open and display the PowerPoint game. You'll get some helpful insight into which math skills your students need to brush up on before the big test day.
TEACHERS LIKE YOU SAID...
⭐️⭐️⭐️⭐️⭐️ Jennifer H. says, "This resource was very fun and engaging. It was also very well put together."
⭐⭐⭐⭐⭐ Johna B. says, "My students loved this resource! I used it at the end of the year to help encourage continuous learning."
_______________________________________
⭐️ Bundle & save for a discount ⭐️
Purchase the 3rd Grade Math Game Shows Bundle to get this game plus Fractions, Place Value, Multiplication and Division, Measurement, Money, and Graphing.
IMPORTANT!
You must have PowerPoint installed on your computer. Also, this file is not editable.
Please note: Purchase of this PowerPoint resource is for SINGLE classroom use only. If you are a technology coordinator for a school or plan on sharing with other teachers, please purchase the correct number of additional licenses at a discounted rate.

Halloween 3rd Grade Graphing: Bar Graphs, Pictographs & Line Plots
By E•Fish•ient Teaching
Get your students excited about data with this Halloween Graphing Bundle! This bundle includes 3 bar graphs, 2 pictographs, and 2 line plots aligned with the 3rd grade curriculum. These graphs are perfect for the month of October with their Halloween themed topics. Students will read the data from a graph, but students will also create their own graph by surveying their classmates! This bundle includes 7 different graphs that are ready to print and use!
TWO TYPES OF GRAPHS
Each type of graph (bar graph, pictograph, and line plot) have at least one graph where students will look at a given graph, read the data, and answer questions about the given graph. Each type of graph will also have a create your own graph. This is where students will have to survey their classmates or get the data themselves to create their own graph. Once they have created their own graph, they will answer questions about their graph. These create your own graphs give students the practice in surveying peers, collecting data, and correctly labeling graphs.
What's included?
- 3 Bar Graphs
- 2 Pictographs
- 2 Line Plots
- Applicable Answer Keys
Features:
- Engaging & Age Appropriate: Crafted for elementary students and aligned with the 3rd grade curriculum. These engaging graphs are easy to understand, making graphing an enjoyable experience.
- Printable & Ready To Use: Simply print each worksheet and you're ready to go. No other materials are needed. Each graph is ideal for classroom use, homework assignments, centers, or individual practice.
- Versatile Use: Perfect for reinforcing graphing skills during Halloween or the month of October, but can be used anytime during the year. The themes of each graph focus closely with Halloween topics.
Benefits
- Enhances Data Interpretation Skills: Students will improve their ability to interpret and create different types of graphs, an essential skill in math and everyday life.
- Builds Confidence: Engaging activities helping build students' confidence in their graphing abilities and hopefully in their social skills as they get to talk with classmates to gather their own data.
Enjoy these spook-tacular graphs during the month of October to reinforce graphing skills.
What have people said about the included graphs?
- Gabriella P said, ⭐⭐⭐⭐⭐ "This activity was so fun for my students! It was a great way to spend Halloween!"
Looking for other graphing activities to add to your classroom? Take a look at these resources.
- Holiday Graphing
- Thanksgiving Graphing
- Spring/Easter Graphing
- Winter/January Graphing
If you enjoyed this product, please leave a review and follow my store. If you would like to see more products by me follow the link E•Fish•ient Teaching. Thank you for your purchase and I hope you enjoy!
Concepts in Algebra |6th Grade PowerPoint Math Lesson Slides| Algebraic Patterns
By Building Bright Brains
Are you teaching your students about Concepts In Algebra For 6th Grade? Plenty of examples and application exercises are included. You can also easily convert this to a Google Slides lesson by dragging it into your Google Drive.
What is included?
✦ 47 total slides for notes, examples and applications.
✦ All steps are animated to allow the teacher to explain them gradually.
At the end of the lesson, students will be able to
✦ Solve Algebraic Patterns
✦ Solve Two-Step Equations
✦ Solve Addition and Subtraction Equations with Integers
✦ Solve Multiplication and Division Equations with Integers
✦ Apply Functions and Ordered Pairs
✦ Apply Graph Ordered Pairs
✦ Apply Graph Functions
This resource is great for:
- In-Classroom Teaching (Displaying for the Whole Class)
- Online Learning
- Homeschooling
- Sharing on Google Classroom or Other Platforms as a Tool for Revision
-Follow us on TeachShare to be informed with new products and updates.
➵➵➵➵➵➵➵➵➵➵➵➵➵➵➵➵➵➵➵➵➵➵➵➵➵➵➵➵➵➵➵➵➵➵➵➵
More Related Products:
⤞ Metric Measurement Area and Volume | 6th Grade PowerPoint Lesson Slides
⤞ Ratio Proportion & Percent | 6th Grade PowerPoint Lesson Slides
⤞ Fractions | Multiplication & Division | 6th Grade PowerPoint Lesson Slides
⤞ Number Theory and Fractions | 6th Grade PowerPoint Lesson Slides
⤞ Add Subtract Multiply & Divide Integers | 6th Grade PowerPoint Lesson Slides
3rd Grade Bar Graphs, Picture Graphs & Line Plots No Prep Math Review Game Show
By That One Cheerful Classroom
Struggling to find a fun way to practice and review bar graphs, line plots, tally charts and pictographs with your 3rd grade class? This fun, interactive, game show style graphing math review game will have your students begging for more activities just like it! Get ready for math prep with the exciting, easy-to-use Graphing Math Game Show.
Please click on the PREVIEW button above to see how the game works!
This math review activity is super fun and engaging for students and EASY for busy teachers to use. With NO PREP needed, you'll be set to review important geometry skills in no time at all!
There are 25 questions at different point values that students can choose from. When they click on any question button, a question appears. Students solve and then you can check answers with the whole class by clicking on the "ANSWER" button.
This engaging 3rd Grade Graphing Game Show includes:
- Teacher’s Guide & Directions
- 25 Math Review Question Slides
- 5 Identifying Graphs
- 5 Reading Graphs
- 5 Graphing Vocabulary
- 5 Parts of a Graph
- 5 Mystery Questions
- 25 Math Review Answer Slides
- Digital, Interactive PowerPoint
There are several ways this game can be used:
- Whole Group Instruction/Review – Display PowerPoint on Smartboard or classroom screen.
- Remote Learning – Share the PowerPoint on your screen with your students.
- Learning Centers – Set up the PowerPoint on a computer or device for students in the center.
Prep is quick and easy... All the hard work is done for you! Just open and display the PowerPoint game. You'll get some helpful insight into which math skills your students need to brush up on before the big test day.
_______________________________________
⭐️ Bundle & save for a discount ⭐️
Purchase the 3rd Grade Math Game Shows Bundle to get this game plus Fractions, Place Value, Multiplication and Division, Measurement, Money, and End of the Year Review.
IMPORTANT!
You must have PowerPoint installed on your computer. Also, this file is not editable.
Please note: Purchase of this PowerPoint resource is for SINGLE classroom use only. If you are a technology coordinator for a school or plan on sharing with other teachers, please purchase the correct number of additional licenses at a discounted rate.
How to get TeachShare credit to use on future purchases:
Go to your "My Purchases" page (make sure you are logged in). Next to each purchase, you'll see a "Provide Feedback" button. Click it and you will be navigated to a page where you can give a rating and leave a comment for that product. Each time you complete feedback, TeachShare will give you feedback credits that you can put towards saving money on future purchases.

5.G.1 BUNDLE! Coordinate Plane Worksheets, Task Cards, Exit Ticket, and Quiz
By Fifth Grade Mathematicians
Are you looking for a resource to teach, practice, and assess CCSS 5.G.1- Coordinate Plane? Look no further! This bundle has everything you need to help your students be successful in mastering Coordinate Plane and Graphing concepts.
What's included?
- 4 practice worksheets
- 24 Task Cards (printable and Google Form version)
- Exit ticket (2 per page for less paper use or to cut and glue into math journals)
- 10 question quick check assessment (printable and Google Form version)
Check out some of my other popular resources below!
- 5th Grade Math Spiral EOG Review Task Card Bundle
- Spiral EOG Review Worksheets- All 5th Grade Standards
- 5th Grade Fractions Unit Bundle! All Fraction Standards

5.OA.3 BUNDLE! Numerical Patterns Worksheets, Task Cards, Exit Ticket, and Quiz
By Fifth Grade Mathematicians
Looking for a fun way to help your students master 5.OA.3- Numerical Patterns? Look no further! This bundle has everything you need to help your students be successful in mastering Numerical Patterns concepts.
What's included:
- 4 practice worksheets
- 24 Task Cards (printable and Google Form version)
- Exit ticket (printable for journals)
- 10 question quick check assessment (printable and Google Form version)
Please see my store for other popular resources!
- 5th Grade Math Spiral EOG Review Task Card Bundle
- Spiral EOG Review Worksheets- All 5th Grade Standards
- 5th Grade Fractions Unit Bundle! All Fraction Standards

Thanksgiving/Fall 3rd Grade Graphs: Bar Graphs, Pictographs, Line Plots: No Prep
By E•Fish•ient Teaching
Get festive this fall with these fun Thanksgiving/Fall skill-building bundle of graphs! This graphing bundle is pack full of fun and engaging activities to help your students grasp essential graphing skills. Each bar graph, pictograph, and line plot is aligned with the 3rd grade core, but can be used with many elementary students ages. Each graph type features two activities: one for analyzing pre-made data and one for creating their own graphs usually surveying their own classmates. These Fall graphs will give students valuable hands-on practice and critical thinking opportunities.
What's Included?
- Line Plots (2 Activities)
- Analyze the Data: A Thanksgiving-themed line plot where students interpret and answer questions about data related to the holiday line plot.
- Create Your Own: Students measure Fall items to the nearest quarter inch and create their own line plot, reinforcing measurement skills and data representation.
2. Bar Graphs (2 Activities)
- Analyze the Data: Students read and interpret data on a pre-made Thanksgiving bar graph, answering questions that help them identify data and make comparisons.
- Create Your Own: Students collect class data, such as favorite Thanksgiving food, and build their own bar graph, practicing data collection, organization, and display.
3. Pictographs (2 Activities)
- Analyze the Data: Students study a Thanksgiving pictograph and answer questions about the information presented, developing their ability to read and interpret pictographs.
- Create Your Own: Students are given data and have to represent it with Thanksgiving-themed icons to create a personalized pictograph, enhancing their creativity and data skills.
4. Teacher’s Guide & Answer Key:
- This bundle includes a teacher’s guide with instructions and answer keys, making it easy to implement and adapt for diverse learners.
Perfect for the month of November! Use these graphs for math center, whole class instruction, homework, or individual practice. Each graph will keep students engaged while building their confidence with graphs. Give your students the practice they need with these bar graphs, pictographs, and line plots.
Features:
- Ready to Use: These no prep graphs are ready to print and use. If you are in a pinch for time, just grab these engaging graphs for your classroom use. ***The line plot activity will need students to have a ruler.***
- Hands-On Learning Activities: Spark curiosity and promote active learning with this collection of hands-on math activities. Whether students are collecting data, creating their own graphs, or analyzing trends, these activities provide valuable opportunities for students to apply their math skills in real-world contexts.
- Measurement to the Quarter Inch: Students will create their own line plot while practicing measurement to the quarter inch.
- Aligned with the Core Standards: This graphing bundle is aligned with 3rd-grade math standards, ensuring that students build essential math skills while exploring seasonal themes.
- Easy Integration: Seamlessly incorporate the graphs and activities into your math lessons, centers, and assessments to enhance student understanding and engagement.
Looking for other holiday graphs? Check these out:
- Holiday/Christmas Graphs
- Winter/January Graphs
- Valentine's Day Graphs
If you enjoyed this product, please leave a review and follow my store. If you would like to see more products by me follow the link Finding the Fish. Thank you for your purchase and I hope you enjoy!

Halloween Math Count & Graph : I Spy Fun from 1 to 10
By Create Learn Inspire Grow
Dive into the festive spirit with "Halloween Math Count & Graph: I Spy Fun from 1 to 10"! This engaging bundle combines counting and graphing activities with a spooky twist. Perfect for young learners, it encourages hands-on practice as they explore Halloween-themed visuals while counting and identifying objects from 1 to 10. Ideal for classrooms or at-home learning, this resource makes math fun and festive!
Math Homework Numeracy Using Data Analysis
By Ms Garcia Store
This content can be adapted to fit the different schedules of each district.
Embark on a two-week math adventure with our engaging Math Homework resource designed for at-home learning! Each week features a four-page homework assignment comprising seven exciting exercises tailored to reinforce Data Analysis skills, aligned with TEKS 1.8 and complementary standards.
Students will delve into the captivating realm of data, where they collect and organize diverse information. Utilizing vibrant picture and bar-type graphs, along with Tally Charts and T-Charts, they will skillfully draw meaningful conclusions, nurturing foundational math skills and fostering a passion for real-world problem-solving.
This at-home learning resource is perfect for reinforcing mathematical concepts, making the subject enjoyable and educational for first-grade students. Elevate your child's math proficiency with these engaging weekly homework assignments!
BONUS FEATURES:
- Parent's Guide: We've included a detailed guide for parents to help them understand each exercise and support their child's learning journey. This resource encourages meaningful parent involvement in their child's education.
- Spanish Translation of the Parent's Guide: To further enhance accessibility and inclusivity, we've provided a Spanish translation of the Parent's Guide. This ensures that non-English-speaking parents can actively participate in their child's mathematical development.
These worksheets are adaptable to various learning environments and cater to diverse learning styles. Use them as homework assignments, in-class activities, or assessment tools to prepare your students for mathematical success.
Download "Numeracy Using Data Analysis" now to witness the growth of your students' Data comprehension. It's a resource that makes learning mathematics enjoyable and effective.
Get the 17 units:
⭐ Numeracy Routines and Systems
⭐ Numeracy Using Data Analysis
⭐ Addition and Subtraction- Represen. Word Problems up to 10
⭐ Measurement of Time- Time to the Hour
⭐ Place Value- Foundations of numbers up to 20
⭐ Addition and Subtraction- Represen. Word Problems up to 20
⭐ Place Value- Foundations of numbers up to 99
⭐ Number Relationships up to 99
⭐ Place Value- Foundations of numbers up to 120
⭐ Number Relationships up to 120 and coins
⭐ Addition and Subtraction Using Data Representations
⭐ Two-Dimensional Figures
⭐ Fractions and Time to the Half Hour
⭐ Three-Dimensional Figures
⭐ Linear Measurement
⭐ Addition and Subtraction Essential Understandings
⭐ Personal Financial Literacy
Thanks to the graphic designers for allowing us to use their images to create this educational resource.
Image by Freepik
Coordinate Plane Review Activity - Digital Escape Room
By Matemaths
Unlock the adventure in this engaging Coordinate Plane Activity Digital Escape Room! Perfect for students who need to master coordinate graphing, this digital escape room immerses them in a thrilling story where a kid gets lost in a forest.
To find their way out, students will solve various coordinate plane challenges including plotting points, reading coordinates, calculating distances (horizontal and vertical), and determining perimeters.
This interactive digital escape room is designed to reinforce key concepts in coordinate graphing while keeping students motivated and entertained.
Ideal for classroom use or remote learning, this activity is easy to integrate into your lesson plans and provides a fun, educational experience.
Plus, it's completely no prep and self-checking, saving you time and ensuring students receive instant feedback.
Key Features:
- Engaging storyline to captivate students’ attention
- Activities focused on plotting and reading points on the coordinate plane
- Exercises to calculate horizontal and vertical distances
- Problems to determine perimeters on the coordinate plane
- No prep required, making it easy to implement
- Self-checking activities for instant feedback
- Suitable for individual or group work
- Perfect for grades 6th
- Compatible with any device connected to the internet
Why Choose This Coordinate Plane Activity?
- Enhances students' understanding of coordinate graphing through practical application
- Provides a unique and interactive learning experience
- Easy to use and implement in various teaching settings
If they need to finish the activity on different days, they just need to use the same device and the same browser. A button "continue" will appear and they will pick up right where they left.
Since this activity is online (interactive pages) there is very little prep; just provide the link, and off they go! There are no locks to configure or clues to hide—everything you need is online. No Google Classroom or Microsoft Teams logins are necessary.
Due to the Terms of Use of the font/clip artists and stock photo websites I purchased from, this product is not editable. Thank you for understanding.
Did you know...
- You can earn credits for future TeachShare purchases by leaving feedback on resources you purchase
- Your satisfaction is my #1 priority! If you encounter any issues with this resource, please contact me so I can resolve any concerns. I proofread carefully and strive to provide you with quality resources, but occasionally one gets by!
Please feel free to contact me anytime!
Email: infomatemaths@gmail.com
Copyright © 2024 Matemaths
All rights reserved by the author.
Permission to copy for single classroom use only.
Not for public display.
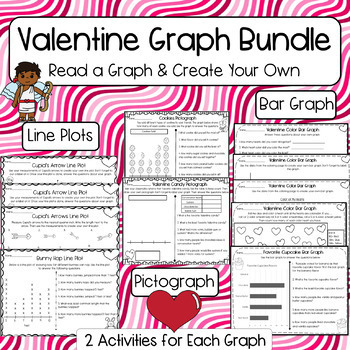
Valentine's Day Graph Bundle: Bar Graph, Line Plot, Pictograph: Measurement
By E•Fish•ient Teaching
This is the perfect graphing bundle for Valentine's Day or February. Each graph has 2 different activities.
Bar Graph: Students will interpret data on a graph about cupcakes. The second bar graph, students will roll a dice and color in the different hearts on the page. Then they will graph the colors of the hearts and answer questions about their graph.
Line Plots: Students will interpret data and answer questions about the different distance bunnies hop. The second line plot, students will measure cupid's arrows to the nearest quarter inch and then graph their findings on the line plot.
Pictograph: Students will interpret data on a pictograph about cookies. The second pictograph, students will survey their classmates to see what their favorite Valentine candy is. Then they will have to answer questions about their pictograph.
6 different graphs with some differentiation on the create your own graphs. There are some graphs with some labels and others that have no labels and the students will have to create their graph from scratch.
If you enjoyed this product, please leave a review and follow my store. If you would like to see more products by me follow the link Finding the Fish. Thank you for your purchase and I hope you enjoy!
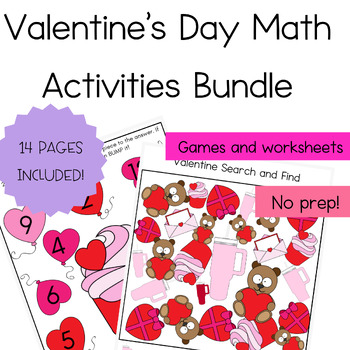
Valentine's Day Math Activities Bundle
By Jessica
There are more than 10 pages included in this Valentine's Day bundle! From fun math games that help students practice counting and addition to a graphing activity, there's something for almost every student 1st through 3rd grade in this bundle!
BONUS! There are free math games that are perfect to finish out winter.
Graphing Templates in Spanish!! Encuestas, Gráficos y Frecuencias.
By La Llama Bilingüe
This resource includes 18 graphing templates in Spanish.
- 1 blank survey template.
- 4 survey templates with choices.
- 4 survey templates with prewritten sentences (kids add key information).
- 2 candy graphing templates (color and BW)
- 1 linking blocks graphing template
- 6 probability (frequency) graphing templates: 3D shapes, food, sports, coins (Canada and USA), and 1 blank.
Just Print and Go!
Olympic Games math!Data and Statistics - Examining the Women's 800M World Record
By Daniel
The Olympic games have gone, so how much fun would it be to study and predict possible World records of the future?
Real-Life Data and Statistics is the most interesting for students. In this fun, DIY Task, (with complete key), students study the women's 800 Meters world record from 1922 tot 2021. They have to
- plot the data on the coordinate plane
- draw a bar graph of the data
- calculate the rate of improvement from one record to the next
- voice their opinion (backed up with facts) on which record was the best.
Also make sure that you include these next 2 products, as they also relate to the World Athletic Games!
If you enjoyed this resource, please leave a REVIEW at your leisure, for other possible buyers to know how you have experienced it. Thank you so much!
Please follow my store here to get notified of all new resources I create.
I love to improve my resources, so any constructive feedback from you will be extremely welcome.
Enjoy this resource.
Types of Graphs Anchor Chart Poster - Pie Charts, Bar Graphs, Line Plots, + More
By That One Cheerful Classroom
This bright and fun colored anchor chart make learning about types of graphs fun and practical. This anchor chart shows students a visual to help students understand the different types of graphs in math. You can use the poster during small group, circle time, whole group, or as a visual on the wall for independent work.
Types of Graphs Included:
- Pie Charts
- Bar Graphs
- Line Plots
- Line Graphs
- Pictographs
- Tally Charts
It is ideal for use with a poster printer, but if you do not have a poster printer, there are instructions on how to print the poster, assemble it, and laminate it for year after year use!
___________________________________
Copyright © That One Cheerful Classroom
Permission to copy for single classroom use only.
Please purchase additional licenses if you intend to share this product.
By Kelly
Just in time for the Winter Games, this Olympics craft and activity set has everything you need for the 2022 Winter Olympics. Set includes both boy and girl Olympian template, graphing activity, writing activities, acrostic poem, and bulletin board letters. Use the templates to create a winter olympian craft or use it for your winter bulletin display.
Graphing, Frequency and Tallying Templates!
By La Llama Bilingüe
This resource includes 18 graphing templates.
- 1 blank survey template.
- 4 survey templates with choices.
- 4 survey templates with prewritten sentences (kids add key information).
- 2 candy graphing templates (color and BW)
- 1 linking blocks graphing template
- 6 probability (frequency) graphing templates: 3D shapes, food, sports, coins (Canada and USA), and 1 blank.
Just Print and Go!
November Math Activities: Worksheets and Review Packet
By May
Fifth Grade November Math Activities! If you want fun, engaging worksheet for November, you found the right resource! This no-prep resource includes so many skills needed as foundations for any math class! This print-and-go resource includes 10 different worksheets to use throughout the turkey season!
You can use this for fourth, fifth, or sixth graders as part of a spiral curriculum or review. This November activity packet can be used in math centers, small groups, early finishers, independent practice, homework, or during direct instruction!
Skills Included:
- Naming and Labeling Coordinate Plane Points
- Decimal Addition
- Adding and Subtracting Decimals
- Money Strategies
- Dividing Fractions
- Finding Equivalent Fractions
- Comparing Fractions
- Number Lines
- Multi-step Equations
- Exponents

Fall Activities for Primary Grades, Pre-K, Special Education
By Rebekah Poe Teaching
These fall activities will get your class in the seasonal spirit! Apples, pumpkins, and leaves team up to help your students practice skills such as counting, single digit addition, graphing, and even sequencing events. From no-prep to low-prep, these ELA and math activities are the perfect addition to your classroom.
Olympic Games! Data and Statistics - Examining the 400M Hurdles World Record
By Daniel
The Olympic Games have finished, and a perfect time to get your kids interested in how records are met and predicted.
Real-Life Data and Statistics is most interesting for students. In this fun, DIY Task, (with complete key), students study the men's 400M hurdles world record from 1908 tot 2021. They have to
- plot the data on the coordinate plane
- draw a bar graph of the data
- calculate the rate of improvement from one record to the next
- voice their opinion (backed up with facts) on which record was the best.
You might also not want to miss out on these resources in the Series on the Olympic Games!
If you enjoyed this resource, please leave a REVIEW at your leisure, for other possible buyers to know how you have experienced it. Thank you so much!
Please follow my store here to get notified of all new resources I create.
I love to improve my resources, so any constructive feedback from you will be extremely welcome.
Enjoy this resource.