Less than $5 3rd Grade Graphing Printables (by price, high to low)

Halloween 3rd Grade Graphing: Bar Graphs, Pictographs & Line Plots
By E•Fish•ient Teaching
Get your students excited about data with this Halloween Graphing Bundle! This bundle includes 3 bar graphs, 2 pictographs, and 2 line plots aligned with the 3rd grade curriculum. These graphs are perfect for the month of October with their Halloween themed topics. Students will read the data from a graph, but students will also create their own graph by surveying their classmates! This bundle includes 7 different graphs that are ready to print and use!
TWO TYPES OF GRAPHS
Each type of graph (bar graph, pictograph, and line plot) have at least one graph where students will look at a given graph, read the data, and answer questions about the given graph. Each type of graph will also have a create your own graph. This is where students will have to survey their classmates or get the data themselves to create their own graph. Once they have created their own graph, they will answer questions about their graph. These create your own graphs give students the practice in surveying peers, collecting data, and correctly labeling graphs.
What's included?
- 3 Bar Graphs
- 2 Pictographs
- 2 Line Plots
- Applicable Answer Keys
Features:
- Engaging & Age Appropriate: Crafted for elementary students and aligned with the 3rd grade curriculum. These engaging graphs are easy to understand, making graphing an enjoyable experience.
- Printable & Ready To Use: Simply print each worksheet and you're ready to go. No other materials are needed. Each graph is ideal for classroom use, homework assignments, centers, or individual practice.
- Versatile Use: Perfect for reinforcing graphing skills during Halloween or the month of October, but can be used anytime during the year. The themes of each graph focus closely with Halloween topics.
Benefits
- Enhances Data Interpretation Skills: Students will improve their ability to interpret and create different types of graphs, an essential skill in math and everyday life.
- Builds Confidence: Engaging activities helping build students' confidence in their graphing abilities and hopefully in their social skills as they get to talk with classmates to gather their own data.
Enjoy these spook-tacular graphs during the month of October to reinforce graphing skills.
What have people said about the included graphs?
- Gabriella P said, ⭐⭐⭐⭐⭐ "This activity was so fun for my students! It was a great way to spend Halloween!"
Looking for other graphing activities to add to your classroom? Take a look at these resources.
- Holiday Graphing
- Thanksgiving Graphing
- Spring/Easter Graphing
- Winter/January Graphing
If you enjoyed this product, please leave a review and follow my store. If you would like to see more products by me follow the link E•Fish•ient Teaching. Thank you for your purchase and I hope you enjoy!

Thanksgiving/Fall 3rd Grade Graphs: Bar Graphs, Pictographs, Line Plots: No Prep
By E•Fish•ient Teaching
Get festive this fall with these fun Thanksgiving/Fall skill-building bundle of graphs! This graphing bundle is pack full of fun and engaging activities to help your students grasp essential graphing skills. Each bar graph, pictograph, and line plot is aligned with the 3rd grade core, but can be used with many elementary students ages. Each graph type features two activities: one for analyzing pre-made data and one for creating their own graphs usually surveying their own classmates. These Fall graphs will give students valuable hands-on practice and critical thinking opportunities.
What's Included?
- Line Plots (2 Activities)
- Analyze the Data: A Thanksgiving-themed line plot where students interpret and answer questions about data related to the holiday line plot.
- Create Your Own: Students measure Fall items to the nearest quarter inch and create their own line plot, reinforcing measurement skills and data representation.
2. Bar Graphs (2 Activities)
- Analyze the Data: Students read and interpret data on a pre-made Thanksgiving bar graph, answering questions that help them identify data and make comparisons.
- Create Your Own: Students collect class data, such as favorite Thanksgiving food, and build their own bar graph, practicing data collection, organization, and display.
3. Pictographs (2 Activities)
- Analyze the Data: Students study a Thanksgiving pictograph and answer questions about the information presented, developing their ability to read and interpret pictographs.
- Create Your Own: Students are given data and have to represent it with Thanksgiving-themed icons to create a personalized pictograph, enhancing their creativity and data skills.
4. Teacher’s Guide & Answer Key:
- This bundle includes a teacher’s guide with instructions and answer keys, making it easy to implement and adapt for diverse learners.
Perfect for the month of November! Use these graphs for math center, whole class instruction, homework, or individual practice. Each graph will keep students engaged while building their confidence with graphs. Give your students the practice they need with these bar graphs, pictographs, and line plots.
Features:
- Ready to Use: These no prep graphs are ready to print and use. If you are in a pinch for time, just grab these engaging graphs for your classroom use. ***The line plot activity will need students to have a ruler.***
- Hands-On Learning Activities: Spark curiosity and promote active learning with this collection of hands-on math activities. Whether students are collecting data, creating their own graphs, or analyzing trends, these activities provide valuable opportunities for students to apply their math skills in real-world contexts.
- Measurement to the Quarter Inch: Students will create their own line plot while practicing measurement to the quarter inch.
- Aligned with the Core Standards: This graphing bundle is aligned with 3rd-grade math standards, ensuring that students build essential math skills while exploring seasonal themes.
- Easy Integration: Seamlessly incorporate the graphs and activities into your math lessons, centers, and assessments to enhance student understanding and engagement.
Looking for other holiday graphs? Check these out:
- Holiday/Christmas Graphs
- Winter/January Graphs
- Valentine's Day Graphs
If you enjoyed this product, please leave a review and follow my store. If you would like to see more products by me follow the link Finding the Fish. Thank you for your purchase and I hope you enjoy!
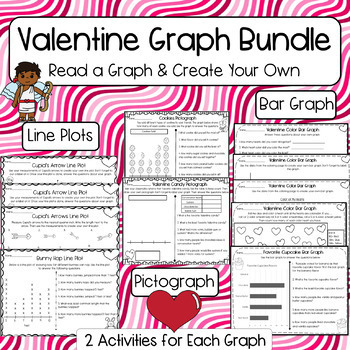
Valentine's Day Graph Bundle: Bar Graph, Line Plot, Pictograph: Measurement
By E•Fish•ient Teaching
This is the perfect graphing bundle for Valentine's Day or February. Each graph has 2 different activities.
Bar Graph: Students will interpret data on a graph about cupcakes. The second bar graph, students will roll a dice and color in the different hearts on the page. Then they will graph the colors of the hearts and answer questions about their graph.
Line Plots: Students will interpret data and answer questions about the different distance bunnies hop. The second line plot, students will measure cupid's arrows to the nearest quarter inch and then graph their findings on the line plot.
Pictograph: Students will interpret data on a pictograph about cookies. The second pictograph, students will survey their classmates to see what their favorite Valentine candy is. Then they will have to answer questions about their pictograph.
6 different graphs with some differentiation on the create your own graphs. There are some graphs with some labels and others that have no labels and the students will have to create their graph from scratch.
If you enjoyed this product, please leave a review and follow my store. If you would like to see more products by me follow the link Finding the Fish. Thank you for your purchase and I hope you enjoy!

St. Patrick's Day & March Graphs: Bar Graphs, Pictographs, & Line Plots
By E•Fish•ient Teaching
Looking for a pot of gold at the end of your graphing unit? Grab this lucky graphing bundle perfect for the month of March and the St. Patrick's Day holiday. This graphing bundle includes themed bar graphs, pictographs, and line plots that will be perfect for your 3rd grade classroom. Each type of graph includes at least 2 graphs for practice. This bundle has a total of 8 graphs for your use. The line plot incorporates another 3rd grade standard of mearsuring items to the nearest quarter inch. Engage your young learners in hands-on data exploration while celebrating the festive spirit of the season.
Features:
- Ready To Use: These no prep graphs are ready to print and use. If you are in a pinch for time, just grab these engaging graphs for your classroom use.
- Themed Practice: From leprechauns and shamrocks to springtime growth and seasonal weather patterns, these visuals bring math to life in a fun and engaging way. Each bar graph, pictograph, and line plot is perfectly themed for the month of March.
- Hands-On Learning Activities: Spark curiosity and promote active learning with this collection of hands-on math activities. Whether students are collecting data, creating their own graphs, or analyzing trends, these activities provide valuable opportunities for students to apply their math skills in real-world contexts.
Why choose this graphing bundle?
- Engaging and Relevant: Capture students' interest with these themed graphs.
- Aligned with Curriculum Standards: This graphing bundle is aligned with 3rd-grade math standards, ensuring that students build essential math skills while exploring seasonal themes.
- Easy Integration: Seamlessly incorporate the graphs and activities into your math lessons, centers, and assessments to enhance student understanding and engagement.
What you'll get...
- 4 Bar Graphs- 2 Create your own bar graphs, 1 read the data, & 1 extension bar graph for differentiation with higher learners.
- 2 Pictographs- 1 create your own graph by surveying students in the classroom, 1 read the data & answer questions
- 2 Line Plots- 1 create your own line plot by measuring rainbows to the nearest quarter inch, 1 read the data & answer questions
Inspire curiosity, ignite a passion for math, and empower your students to become confident data analysts with themed activities and graphs that make math fun! Get this St. Patrick's Day & March Graphs today and watch your students' math skills bloom like spring flowers!
I hope you enjoyed this product! If you liked it, please leave me a review. If you would like to see some of my other products please follow along at Finding The Fish.
Winter/January Graphs: Pictograph, Line Plot, Bar: Read & Create Your Own Graphs
By E•Fish•ient Teaching
Winter or January Graphs!! Bar graphs, pictographs, and line plots! Each graph has two different activities. One is just reading the graph and the other is having the students create their own graph. These ready to print and use graphs will be a great addition to your classroom.
Bar Graphs- answer questions about a bar graph and create your own bar graph by counting up the different items you see. Pictograph- answer questions about the given pictograph and create your own with the data given on the worksheet. Line plot- answer the questions about the line plot and create your own line plot by measuring the different snowflakes and then plotting them on the line plot.
If you enjoyed this product, please leave a review and follow my store. If you would like to see more products by me follow the link Finding the Fish. Thank you for your purchase and I hope you enjoy!
Easter Graphing Worksheets First Grade
By Primary Piglets
Get ready for some Easter Graphing!
Less hassle than graphing jelly beans, these pages are perfect for Spring just Print & Go! Students love "Spin & Graph" pages, they are fun & engaging. This is a set of 8 pages of graphing practice Easter themed. 4 pages are "Spin & Graph", the other 4 are "Count, Tally & Graph pages."
❤️ FOLLOW ME, PRIMARY PIGLETS and grab the latest freebies and deals!
Related Products
❤️ Easter Directed Drawings Boom Cards
❤️ Color by Number Easter Bundle
❤️ Color by Number Math Facts ALL YEAR BUNDLE
❤️ Addition and Subtraction Color by Number ALL YEAR
❤️ Color by Number ALL YEAR Bundle
There are 4 Count, Tally & Graph Pages in each Set: Students color by picture, then count and tally in spaces provided. Then color in graph to show data.
There are 4 Spin & Graph Pages in each Set: Students use a paperclip and pencil to spin. Color in the graph each time you spin until one of the pictures reaches the top of the graph. Look over your data and write an "I noticed..." statement. Examples; I noticed there were more bells than trees. I noticed there were 3 more blank than blank. I noticed the blank were the least.
Halloween Graphing Worksheets 1st 2nd Grade
By Primary Piglets
Get ready for October with these HALLOWEEN GRAPHING WORKSHEETS!
These pages are perfect for October, just Print & Go! Students love "Spin & Graph" pages, they are fun & engaging.
✅Click here for more GRAPHING PRODUCTS...
✅Click here for more HALLOWEEN FUN...
✅Click here for HALLOWEEN BOOM CARDS...
COUNT, TALLY & GRAPH - 4 pages
Students color by picture, then count and tally in spaces provided. They color in the graph to represent the data.
SPIN & GRAPH - 8 pages
Students use a paperclip and pencil to spin. Color in the graph each time you spin until one of the pictures reaches the top of the graph.
- 4 pages have questions to answer.
- 4 pages with the same spinners as the previous 4 pages, but with an open ended data format. Look over your data and write an "I noticed..." statement. Examples; I noticed there were more bells than trees. I noticed there were 3 more blank than blank. I noticed the "-----" were the least.
Cinco de Mayo Graphing Worksheets | First Grade Second Grade Graphing Worksheets
By Primary Piglets
Get ready for celebrating Cinco de Mayo with these fun graphing activities!
Graphing worksheets consist of Spin & Graph style and Count & Graph style.
COUNT, TALLY & GRAPH - 4 pages
Students color by picture, then count and tally in spaces provided. They color in the graph to represent the data.
SPIN & GRAPH - 8 pages
Students use a paperclip and pencil to spin. Color in the graph each time you spin until one of the pictures reaches the top of the graph.
4 pages have questions to answer.
4 pages with the same spinners as the previous 4 pages, but with an open ended data format. Look over your data and write an "I noticed..." statement. Examples; I noticed there were more blank than blank. I noticed there were 3 more blank than blank. I noticed the "-----" were the least.
Related Products
❤️ Cinco De Mayo Directed Drawings Boom Cards
❤️ Cinco de Mayo Math Color by Number Math Facts Bundle
❤️ Cinco de Mayo Math Color by Number Multiplication Division BUNDLE
❤️ Cinco de Mayo Math Graphing Worksheets
❤️ Color by Number Cinco de Mayo Addition Subtraction Multiply Division Bundle of 5
St. Patrick's Day Graphing Worksheets Math Activities First Grade Morning Work
By Primary Piglets
Get ready for some St. Patrick's Day Graphing!
These pages are perfect for St Patricks Day just Print & Go! Students love "Spin & Graph" pages, they are fun & engaging. This is a set of 8 pages of graphing practice St. Patrick's Day themed. 4 pages are "Spin & Graph", the other 4 are "Count, Tally & Graph pages."
$$$$$ ⭐ CLICK HERE FOR DOLLAR DEALS! ⭐ $$$$$
There are 4 Count, Tally & Graph Pages in each Set: Students color by picture, then count and tally in spaces provided. Then color in graph to show data.
There are 4 Spin & Graph Pages in each Set: Students use a paperclip and pencil to spin. Color in the graph each time you spin until one of the pictures reaches the top of the graph. Look over your data and write an "I noticed..." statement. Examples; I noticed there were more bells than trees. I noticed there were 3 more blank than blank. I noticed the blank were the least.

Holiday/Christmas Graphing: Bar Graphs, Pictographs, Line Plots: Read & Create
By E•Fish•ient Teaching
Bar graphs, pictographs, and line plots Oh My! The perfect holiday/Christmas graphing bundle. These ready to print and use graphs are great for the month of December. There are line plots, bar graphs, and pictographs. Students will practice reading the graphs and answering questions. Then each graph students will be able to gather their own data by asking classmates or counting objects. Then they will take their data they collected and graph their findings. This is a perfect review or introduction to bar graphs, pictograph, and line plots. There are 6 pages of practice.
What's Included:
- 2 Line Plots
- 2 Bar Graphs
- 2 Pictographs
- Answer Keys
Each graph has one graph where you read and interpret the data given on the worksheet. The second graph requires students to create their own graph, by asking classmates questions, measuring things, etc. This allows the students to practice labeling graphs and creating their own.
What people are saying:
Sabrina R was very satisfied saying, "Great resource during the holidays, after we studied graphs."
Interested in more products like this? Check out these...
Valentine's Graphing Bundle
Winter Graphing
Holiday Research Project
If you enjoyed this product, please leave a review and follow my store. If you would like to see more products by me follow the link Finding the Fish. Thank you for your purchase and I hope you enjoy!
Blank Graph Paper Printable, Square Grid Math Template for Long Division
By Truly Neat Printables
Printable square grid graph papers are beneficial for math students. This blank graph paper template features grid lines that can be used for solving various math problems such as multiplication, division, addition, subtraction, drawing geometric shapes and more. These are also great for special education students.
This set includes :
11 Pages, pdf format
Size (8x11.5 Inches)
These papers are for personal use only.
Restrictions: You are not allowed to share, resell or redistribute this product in their original format. You may not claim my work as your own.
All graphics belong to Truly Neat Printables.
This is an instant digital download. No product will be sent to you.

End of the Year Graphing: Bar Graphs, Pictographs, & Line Plots
By E•Fish•ient Teaching
This is the perfect bundle for the end of the year graphing. There are 6 different graphs included. 2 graphs for each category, pictograph, bar graph, and line plot. Each category includes one graph that students will need to interpret and answer questions. The other is where students will have to create their own graph, including labeling their own graph. All but one of these graphs are printable and ready to use without any extras. There is one graph that requires the teacher to provide a watermelon for the class.
What's included:
- 2 bar graphs
- 2 pictographs
- 2 line plots
If you enjoyed this product, please leave a review and follow my store. If you would like to see more products by me follow the link Finding the Fish. Thank you for your purchase and I hope you enjoy!
If you are interested in other graphs, you might also like these:
- Holiday/Winter Graphs
- Halloween Graphs
- Thanksgiving Graphs
- Valentine Graphs
Copyright © Finding the Fish
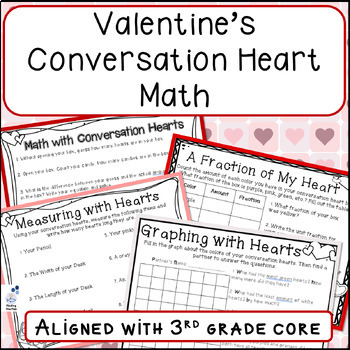
Valentine's Conversation Hearts Math: Fractions, Measurement, Graphs, Rounding
By E•Fish•ient Teaching
This is a perfect math bundle for Valentine's Day. It is aligned with the 3rd grade core, but could be used for any grade 3rd or higher. All you need to do these math pages is a box of conversation hearts for each student.
- There are 2 pages, Math with Conversation Hearts, that have students estimate, round, and make patterns with their hearts in their box.
- There are 2 pages, A Fraction of My Heart, where students will write down the fraction of the different colors and sayings in their conversation box. Then they will answer questions about their fractions.
- There are 2 pages, Graphing with Hearts, where students will graph the different colors they find in their box and also graph the different sayings in their box. Then there are a few questions to answer about their graphs.
- The last page is, Measuring with Hearts, where students will use their hearts to measure different items listed on their page.
This is a simple go to lesson for practicing math skills. It is perfect for Valentine's Day and no prep.
If you enjoyed this product, please leave a review and follow my store. If you would like to see more products by me follow the link Finding the Fish. Thank you for your purchase and I hope you enjoy!
Super Bowl Coordinate Graphing Picture: Trophy 2021
By Qiang Ma
This coordinate plane Football Super Bowl LV 2021 graphic art would be ideal for students that are just beginning with graphing coordinates or students that need a little extra practice. It is also a great fun activity for Super Bowl. Use for Super Bowl, or any time of the year.
The pictures have two different graphing options to easily provide differentiation in your classroom. Prep free! Differentiated!
- One picture to be graphed in first quadrant with positive whole numbers only only
- One picture to be graphed in all four quadrants with positive and negative whole numbers
=====================================================
If you like this lesson, you may also like my other products in this category:
All Coordinate Plane Graphing Products
All Math Products
All Super Bowl/Sports Products
All Four Seasons Products
All Product Bundles
All Language Art Products
All Science Products
All History Products
All Arts/Crafts/Projects Products
=====================================================
Thank you so much and I hope you enjoy this lesson.
• Check out my store https://www.TeachShare.com/store/Qiang-Ma for more lessons to help your students have fun while learning!
• Comments, suggestions, feedback and questions always welcomed!
• Each time you give feedback, TeachShare gives you feedback credits that you use to lower the cost of your future purchases. I value your feedback greatly!
• Be sure to click on the green ★ to follow me for updates and new product announcements!
=====================================================
EngageNY Eureka Module 6 Surveys and Graphs 3rd Grade
By Basic Biz Teaching
These no-prep, ready to use, worksheets will give your third grade or second grade students the ample practice they need to survey and collect data. Practice surveys and graphs with ease with these eight worksheets.
These worksheets will have your students:
- surveying classmates
- collecting data
- using tally marks
- answering questions using the data
- creating picture graphs
- changing the scale
Topics include:
- favorite pizza topping
- favorite fruit
- favorite ice cream flavor
- favorite sport
Perfect to use while teaching Module 6 from Eureka EngageNY or even during the beginning of the school year to get to know each other.
Remember to leave FEEDBACK! Feedback earns you credits towards future purchases.
Remember, this item is for your classroom ONLY.
Super Bowl Coordinate Graphing Picture: Trophy 2021
By Qiang Ma
This coordinate plane Football Super Bowl LV 2021 graphic art would be ideal for students that are just beginning with graphing coordinates or students that need a little extra practice. It is also a great fun activity for Super Bowl. Use for Super Bowl, or any time of the year.
The pictures have two different graphing options to easily provide differentiation in your classroom. Prep free! Differentiated!
- One picture to be graphed in first quadrant with positive whole numbers only only
- One picture to be graphed in all four quadrants with positive and negative whole numbers
=====================================================
If you like this lesson, you may also like my other products in this category:
All Coordinate Plane Graphing Products
All Math Products
All Super Bowl/Sports Products
All Four Seasons Products
All Product Bundles
All Language Art Products
All Science Products
All History Products
All Arts/Crafts/Projects Products
=====================================================
Thank you so much and I hope you enjoy this lesson.
• Check out my store https://www.TeachShare.com/store/Qiang-Ma for more lessons to help your students have fun while learning!
• Comments, suggestions, feedback and questions always welcomed!
• Each time you give feedback, TeachShare gives you feedback credits that you use to lower the cost of your future purchases. I value your feedback greatly!
• Be sure to click on the green ★ to follow me for updates and new product announcements!
=====================================================

Printable Blank Graph Templates | Pictograph Worksheet | Editable Bar Graph
By Kingdom of Printables
This bundle includes Blank Pictograph and Bar Graph Worksheet Templates, perfect for young learners to practice graphing. The pictograph template has 15 pages with different sizes, and the bar graph template includes 9 pages with different layouts. Great for math activities, data collection, and classroom use!
What You will Get
- ( PDF + PNG ) Format
- HIGH QUALITY
- SIZE :8.5'x'11
NOTE
- This is a digital item.
- No physical product or printed material will be shipped.

Spring & Easter Graphs: Line Plots, Pictographs, & Bar Graphs: 3rd Grade
By E•Fish•ient Teaching
These egg-travegant graphs will fit perfectly in your classroom as you explore data and graphing. This graphing bundle includes themed bar graphs, pictographs, and line plots perfect for the 3rd grade classroom. Each type of graph includes 2 graphs for practice. One graph is always a create your own graph and the other is reading the data and answering questions about the given graph. There are 6 graphs included in this bundle. Engage your learners with hands-on data exploration while celebrating Spring and the Easter season.
Features:
- Ready To Use: These no prep graphs are ready to print and use. If you are in a pinch for time, just grab these engaging graphs for your classroom use.
****Teacher will need to provide Jellybeans for each student**** - Hands-On Learning Activities: Spark curiosity and promote active learning with this collection of hands-on math activities. Whether students are collecting data, creating their own graphs, or analyzing trends, these activities provide valuable opportunities for students to apply their math skills in real-world contexts.
- Measurement to the Quarter Inch: Students will create their own line plot while practicing measurement to the quarter inch.
What is so great about this Springtime graphing bundle?
- Engaging and Relevant: Make learning about graphing fun! Capture your students interest with engaging graphs and interactions with classmates.
- Aligned with the Core Standards: This graphing bundle is aligned with 3rd-grade math standards, ensuring that students build essential math skills while exploring seasonal themes.
- Easy Integration: Seamlessly incorporate the graphs and activities into your math lessons, centers, and assessments to enhance student understanding and engagement.
What you'll get...
- 2 Bar Graphs- 1 Create your own bar graph & 1 read the data with answer key
- 2 Pictographs- 1 Create your own pictograph & 1 read the data with answer key
- 2 Line Plots- 1 Create your own line plot by measuring to the nearest quarter inch & 1 read the data with answer key
Inspire curiosity, ignite a passion for math, and empower your students to become confident data analysts with themed activities and graphs that make math fun!
I hope you enjoyed this product! If you liked it, please leave me a review. If you would like to see some of my other products please follow along at Finding The Fish.
Printable Blank Pictograph Worksheet Template for Primary & Kindergarten
By Kingdom of Printables
This Blank Pictograph Worksheet Template is great for kindergarten and primary students to practice graphing. It includes different sizes across 15 pages. You will get PDF, and PNG files, making it easy to print or edit. Perfect for math activities and data collection!
What You will Get
- 15 Pages
- ( PDF + PNG ) Format
- HIGH QUALITY
- SIZE :8.5'x'11
NOTE
- This is a digital item.
- No physical product or printed material will be shipped.
Back to school Graphing Bar Graph Getting to Know You Icebreaker Activities
By Epsilon Math Craft & Special Education
Great way to start the first week of school while also reviewing graphing skills and data collection. Best for First Grade/Second Grade/Third Grade or advanced Kindergarten (with tally chart). This will easily give you insight on what is the favorite subject for your kids.
See preview for full details.
You may like:
- Polygons for beginners.
- Coordinate for beginners.
- Fractions for beginners.
Don't forget that leaving feedback earns you points toward FREE TeachShare purchases.
All the resources I make are free for the first 24 hours! so follow my store <3 to stay updated every time I post.
keywords:(not necessarily related to the topic)
- kindergarten
- kindergarten morning work
- kindergarten coloring pages
- kindergarten math
- all about me worksheets
- all about me bag
- all about me poster
- kindergarten
- kindergarten morning work
- kindergarten coloring pages
- kindergarten math
- folder labels keep at home and return to school
- return to school keep at home labels