Homeschool Statistics Resources

35 Real-Life Math Applications for Algebra 1 Algebra 2 Pre-Calculus, tasks, keys
By Daniel
No better exercise for children to do to cement all the Math they have learnt thus far.
So make sure you take advantage of this incredible resource, as it could keep them busy for quite a while!
These tasks, (with complete keys) help teachers and their students see in a powerful way where and how the math they do gets applied in real life. A sample of the 35 products include:
- Division, prime numbers and Encryption
- Trig and building a lean-to roof.
- Geometric Sequences and Financial investments
- Slope and building the right stairs for old people.
- Statistics and making informed consumer choices.
- Line of best fit and predicting Track world records.
- Logs, Ln, e and Financial investments
- Linear Equations and Optimization (Linear Programming)
- Exponents and Encryption
- Pythagoras and design and gardening
If you enjoyed this resource, please leave a REVIEW at your leisure, for other possible buyers to know how you have experienced it. Thank you so much!
Please follow my store here to get notified of all new resources I create.
I love to improve my resources, so any constructive feedback from you will be extremely welcome.
Enjoy this resource.
Methods of Data Analysis | Poster on Mean, Median, Mode and Range
By LittleStreams
This is a simple and completely FREE poster on the four common methods of data analysis. It states simply how to find each. You may also like: Mean, Median and Mode Bingo Averages Follow Me Cards Mean Wars Averages Card Game If you have any comments or suggestions, and to stay updated please follow us or take a look at our Facebook Page Please click here to visit our website for more information about LittleStreams
Data and Statistics | 6th Grade PowerPoint Math Lesson Slides | Circle Graphs
By Building Bright Brains
Are you teaching your students about Data and Statistics For 6th Grade? Plenty of examples and application exercises are included. You can also easily convert this to a Google Slides lesson by dragging it into your Google Drive.
What is included?
✦ 9 total slides for notes, examples and applications.
✦ All steps are animated to allow the teacher to explain them gradually.
At the end of the lesson, students will be able to
✦ Interpret Circle Graphs.
✦ Use a circle graph to complete s table.
✦ Use a circle graph to answer questions.
This resource is great for:
- In-Classroom Teaching (Displaying for the Whole Class)
- Online Learning
- Homeschooling
- Sharing on Google Classroom or Other Platforms as a Tool for Revision
-Follow us on TeachShare to be informed with new products and updates.
➵➵➵➵➵➵➵➵➵➵➵➵➵➵➵➵➵➵➵➵➵➵➵➵➵➵➵➵➵➵➵➵➵➵➵➵
More Related Products:
⤞ percentage of a number | 6th Grade PowerPoint Lesson Slides
⤞ Concepts in Algebra | 6th Grade PowerPoint Lesson Slides | Algebraic Patterns
⤞ Metric Measurement Area and Volume | 6th Grade PowerPoint Lesson Slides
⤞ Ratio Proportion & Percent | 6th Grade PowerPoint Lesson Slides
⤞ Fractions | Multiplication & Division | 6th Grade PowerPoint Lesson Slides
Get Sporty with Interquartile Ranges
By YourTeachingDoc
Do you need help teaching your students about the "middle 50" in a data set? Introduce Interquartile Ranges in a fun and engaging way with this worksheet. Students will analyze the scores of the two teams and determine which has the best point spread. You can even customize the teams to feature your favorites!
♯ Please review TOU before purchasing.
Be sure to look at the Preview and Thumbnails to ensure this activity aligns with your students/curriculum. If you have any questions, please contact me HERE BEFORE purchasing any item in my store so I can ensure you are satisfied with your purchase.
♯ HOW TO GET TeachShare CREDITS ON FUTURE PURCHASES:
- Go to MY PURCHASES page.
- You will see a PROVIDE FEEDBACK button.
- Please leave a star rating and a comment. This will help lower the cost of future purchases!
Scatter Plots 8th Grade | Digital and Printable
By Matemaths
This digital and printable activity is designed specifically for 8th-grade students. This resource offers an approach to practicing scatter plots through a variety of hands-on and self-checking activities.
What’s Included:
- Reference Guide: A clear and concise reference page that provides students with the foundational concepts and vocabulary needed to master transformations.
- 20 Varied Problems: A collection of 20 interactive problems that encourage students to apply their knowledge.
- Digital Convenience: All activities are available in a digital format, allowing for immediate feedback and fostering a self-paced learning environment.
- Printable Handouts: For traditional classroom settings or homework assignments, printable handouts are included to complement the digital experience.
- Detailed Solutions: Complete solutions are provided for each problem, ensuring that students can check their work and teachers can facilitate discussions with ease.
Perfect for:
- practicing,
- homework,
- reviewing material,
- an emergency substitute lesson plan!
Since this activity is online (interactive pages) there is very little prep; just provide the link, and off they go! There are no locks to configure or clues to hide—everything you need is online. No Google Classroom or Microsoft Teams logins are necessary.
Due to the Terms of Use of the font/clip artists and stock photo websites I purchased from, this product is not editable. Thank you for understanding.
Did you know...
- You can earn credits for future TeachShare purchases by leaving feedback on resources you purchase
- Your satisfaction is my #1 priority! If you encounter any issues with this resource, please contact me so I can resolve any concerns. I proofread carefully and strive to provide you with quality resources, but occasionally one gets by!
Please feel free to contact me anytime!
Email: infomatemaths@gmail.com
Copyright © 2024 Matemaths
All rights reserved by the author.
Permission to copy for single classroom use only.
Not for public display.
Rates Unit Rate Ratios and Proportional Relationships Word Problems 6.RP | 7.RP
By Epsilon Math Craft & Special Education
This resource focuses on understanding the Relationship between Ratios, Rates and Unit Rates. The worksheet has 25 fill-in questions that are Common Core aligned (6.RP.A.2) .
See preview above for more details.
The PDF has 25 total questions with answer keys :
Questions 1: Give the definitions of the three comparisons (Ratio-Rate-Unit rate).
Question 2: Activity that groups ratios, rates, and unit rates in a box + four questions for students to explain the difference between the comparisons.
Question 3: Table to class different examples of ratios.
Question 4: Example of how to convert a rate into a unit rate+ eight questions for a student to find the unit rate.
Question 5: Circle the unit rates among ratios.
Question 6: Two word problems to identify the best rate.
Question 7: Draw a line from the rate to its unit rate between two situations.
Question 8: True or false.
Questions 9&10: Eight cases to determine the best deal on a purchase.
Question 11: Word problems.
Make sure to go check the first lesson's worksheet about Writing ratios (6.RP.A.1).
You may like:
- Fractions for beginners.
- Polygons for beginners.
- Coordinate for beginners.
My freebie:
Free Long division Practice Worksheets.
Don't forget that leaving feedback earns you points toward FREE TeachShare purchases.
All the resources I make are 50% off for the first 24 hours so follow my store <3 to stay updated every time I post.
keywords:(not necessarily related to the topic)
- math
- 7th grade math review
- 7th grade math
- 7th grade math fun worksheets
- 7th grade math spiral review
- 6th grade math review
- 6th grade math
- 6th grade math spiral review
- 6th grade math test prep
- 6th grade math escape room
- 7th grade math test prep
- ratios
- ratios and proportions
- ratios and rates
- ratios activity
- ratios worksheets
- math worksheets
- math games
- math mystery
- math centers
- math
- math worksheets
- math games
- math mystery
- math centers
- math
- math worksheets
- math games
- math mystery
- math centers

29 Real-Life Math Applications for Middle School Mathematics, activities+keys
By Daniel
No better exercise for children to do to cement all the Math they have learnt thus far! So, be sure to take advantage of this offer, as it could keep them busy for quite a while!
This Real-Life Math bundle contains 29 different tasks, (with complete keys), of where Middle School math gets applied in the real world. It will keep the children fascinated by how all they Math they learn is applicable to the Real World that we live in!
The work will keep your students very engaged since all of it has been tried, tested and refined in my daily classroom over many years. Demonstrate practically to students the answers to the following questions:
- Why do we have to learn this?
- Where is this ever used in real life?
This product can be used for
groupwork
discovery exercises
assessment
independent study
a complete home-school Real-Life Math application curriculum for a middle school student.
If you enjoyed this resource, please leave a REVIEW at your leisure, for other possible buyers to know how you have experienced it. Thank you so much!
Please follow my store here to get notified of all new resources I create.
I love to improve my resources, so any constructive feedback from you will be extremely welcome.
Enjoy this resource.
Statistics Bingo for Mean, Median & Mode
By LittleStreams
This product is available in a discounted 5 game bundle. Click here to see.
This game contains bingo cards and 54 question cards that contain a series of numbers for players to work out mean, median and mode.
This game is an easily printed and prepared thanks to easy-cut guides. It comes with well-explained rules of play, and makes a great time filler for an entire class or a high quality game for one on one tuition. Download the PDF preview now to see the game up close.
We also have Mean Wars Card Game
We love getting feedback. Don't forget to rate us and leave feedback, and you will receive TeachShare credits to put toward future purchases.
----
If you have any comments or suggestions, and to stay updated please follow us or take a look at our Facebook Page
Please click here to visit our website for more information about LittleStreams
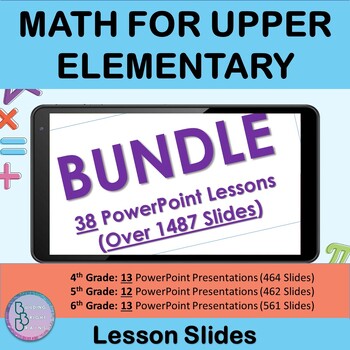
Math Bundle for Upper Elementary | PowerPoint Presentation Lesson Slides
By Building Bright Brains
Are you looking for a Math Bundle for Upper Elementary? Check out this special bundle that includes our best-selling For Fourth, Fifth, and Sixth Grade Math Units! These Lessons are research-based and designed specifically for upper elementary teachers and students.
What is included?
✦ This Bundle includes 38 PowerPoint Lesson Slides (Over 1480 Slides)
4th Grade
1. Addition and Subtraction with and without Regrouping
2. Decimals
3. Divide By One Digit
4. Divide By Two Digit
5. Fractions
6. Fractions Addition and Subtraction
7. Geometry
8. Get Ready For Algebra
9. Measurement and Metric System
10. Multiplication
11. Place value to Thousands and Millions
12. Probability and Statistics
13. Solid Figures and Polygons
5th Grade
1. Algebraic Expressions & Equations
2. Decimals and Place Value
3. Division
4. Fractions Addition and Subtraction
5. Geometry
6. Geometry Booklet
7. Metric Measurement Area and Volume
8. Metric Units of Capacity
9. Multiplication
10. Multiplication and Division
11. Number Theory and Fractions
12. Place Value, Addition, And Subtraction
6th Grade
1. Add, Subtract, Multiplying & Dividing Integers
2. Concepts In Algebra
3. Data and Statistics
4. Division whole numbers
5. Expressions and Equations
6. Fractions Multiplication and Division
7. Geometry Booklet
8. Metric Measurement Area and Volume
9. Multiplication Whole numbers and decimals
10. Number Sense, Addition, & Subtraction
11. Number Theory and Fractions
12. percentage of a number
13. Ratio, Proportion & Percent
This Bundle is great to be used for:
- In-Classroom Teaching (Displaying for the Whole Class)
- Online Learning
- Homeschooling
- Sharing on Google Classroom or Other Platforms as a Tool for Revision
-Follow us on TeachShare to be informed with new products and updates.
Check The Temp - Measuring the Median
By YourTeachingDoc
The Median can be a difficult concept for students to master. A relevant approach to teaching the statistical value of the Median is to have students determine the High and Low temperatures of the weather for a week. To facilitate this, a worksheet has been designed as an easy way to integrate extra practice during Bell Ringers or Warm-Up activities.
6th Grade Ratios Activities: Ratios Word Problems Word Problems 6.RP | 7.RP
By Epsilon Math Craft & Special Education
This resource focuses on understanding the Relationship between Ratios, Rates and Unit Rates. The worksheet has 25 fill-in questions that are Common Core aligned (6.RP.A.2) .
See preview above for more details.
The PDF has 25 total questions with answer keys :
Questions 1: Give the definitions of the three comparisons (Ratio-Rate-Unit rate).
Question 2: Activity that groups ratios, rates, and unit rates in a box + four questions for students to explain the difference between the comparisons.
Question 3: Table to class different examples of ratios.
Question 4: Example of how to convert a rate into a unit rate+ eight questions for a student to find the unit rate.
Question 5: Circle the unit rates among ratios.
Question 6: Two word problems to identify the best rate.
Question 7: Draw a line from the rate to its unit rate between two situations.
Question 8: True or false.
Questions 9&10: Eight cases to determine the best deal on a purchase.
Question 11: Word problems.
Make sure to go check the first lesson's worksheet about Writing ratios (6.RP.A.1).
You may like:
- Fractions for beginners.
- Polygons for beginners.
- Coordinate for beginners.
My freebie:
Free Long division Practice Worksheets.
Don't forget that leaving feedback earns you points toward FREE TeachShare purchases.
All the resources I make are 50% off for the first 24 hours so follow my store <3 to stay updated every time I post.
keywords:(not necessarily related to the topic)
- math
- 7th grade math review
- 7th grade math
- 7th grade math fun worksheets
- 7th grade math spiral review
- 7th grade math test prep
- ratios
- ratios and proportions
- ratios and rates
- ratios activity
- ratios worksheets
- math worksheets
- math games
- math mystery
- math centers
- math
- math worksheets
- math games
- math mystery
- math centers
Real-Life Math Fun!Pre-Algebra Quant Data, Evaluate Measures of Central Tendency
By Daniel
It is always a good strategy to review essential skills with your students, and this is right up there with the most essential!
This data and statistics project is a fun practical, real-life way to analyze and compare data by making use of real-life data, statistics and plots like a box-and-whisker and a scatter plot. Refresh the concepts of mean, median, mode, range, 1st quartile, 3rd quartile, outliers, minimum, maximum by comparing how high and how far students in 2 different classes jumped.
This project is tried, tested and refined over many years in my own middle and high school classrooms. It breathes new life into topics that will be stale, boring and old if not done in a real-life way. Students will be able to debate and defend certain viewpoints using the data and their own analysis of it.
Data, Statistics, Box-and-Whisker Plot, Box Plot, Scatter Plot, Mean, Median, Mode, Range, Quartile 1, Quartile 3, Minimum, Maximum, Inter-Quartile Range, Outliers, Correlation, Positive Correlation, Negative Correlation, Correlation Coefficient, Line of best fit.
You might also want to look at this resource for more Real-Life Math into the subject!
https://www.TeachShare.com/Product/Real-Life-Back-to-school-Task-for-Data-and-Statistics-Outliers-Mean-Median-IQR-8696757
If you enjoyed this resource, please leave a REVIEW at your leisure, for other possible buyers to know how you have experienced it. Thank you so much!
Please follow my store here to get notified of all new resources I create
I love to improve my resources, so any constructive feedback from you will be extremely welcome.
Enjoy this resource.
What is the Mean? | Free Poster
By LittleStreams
A completely FREE poster on what the Mean in statistics is, why it's important and it's properties. You may also like: Mean, Median and Mode Bingo Averages Follow Me Cards Mean Wars Averages Card Game If you have any comments or suggestions, and to stay updated please follow us or take a look at our Facebook Page Please click here to visit our website for more information about LittleStreams
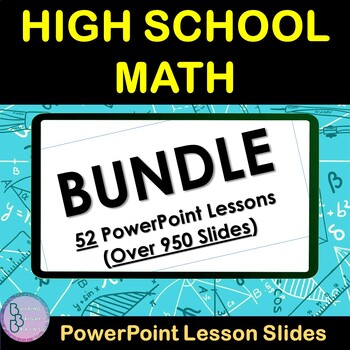
High School Math Bundle | PowerPoint Lesson Slides | Derivative, Vectors, Powers
By Building Bright Brains
Are you a High school Math teacher who is looking for rigorous lessons to strengthen and supplement your explanation? This Bundle is perfect for you! It includes lessons on Equations, Derivative of Functions, Vectors, Statistics, Square Roots, Polynomials and many others!
What is included?
✦ This Bundle includes 52 PowerPoint Lesson Slides (Over 950 Slides)
1. Absolute value and intervals
2. Addition of Vectors
3. Angles in Circles using Tangents
4. Complex Numbers
5. Coordinate system
6. Counting Principle
7. Derivative of Functions and Trigonometric Functions
8. Equation of a circle
9. Equation of straight lines
10. Equations and polynomials of the second degree
11. Equations of Parallel and Perpendicular Lines
12. Exponential Functions
13. First Degree of Equations and Inequalities
14. Fractional Expressions
15. Functions and Graphing
16. Functions Limit - continuity- derivative
17. Functions limits and continuity
18. Generalities of Functions
19. Generalities of Functions part 2
20. Integration
21. Linear Functions and Proportionality
22. Linear System
23. Lines and Planes in space
24. Logarithm Functions
25. Numerical Sequence
26. Order on R- Framing and approximation
27. Orthogonality In Space
28. Parallel Lines and Planes
29. polynomial functions
30. Polynomial of One Variable
31. Polynomials
32. Powers and Radicals
33. Primitives Anti-Derivative
34. Rational & Irrational Numbers
35. Rational and Irrational Functions
36. Right Triangle Trigonometry
37. Scalar Product in Space
38. Scalar Product of Vectors
39. Sets and Cartesian product
40. Sign of The 2nd Degree Polynomials
41. Square Roots part 2
42. Statistics Part 1
43. Statistics Part 2
44. Straight Lines and Planes
45. Systems of Equations
46. Thales' Theorem
47. Trigonometric Formulas (Addition and Transformation Formulas)
48. Trigonometric Lines and Circles
49. Trigonometry (Trigonometric Equations)
50. Vector Product & vector mixed product
51. Vectors (Multiplication of a Vector by a Real Number)
52. Vectors And Systems in Space
This Bundle is great to be used for:
- In-Classroom Teaching (Displaying for the Whole Class)
- Online Learning
- Homeschooling
- Sharing on Google Classroom or Other Platforms as a Tool for Revision
-Follow us on TeachShare to be informed with new products and updates.
Best Real Life Math Task for Data and Statistics - Outliers Mean Median IQR
By Daniel
A brilliant Real-Life activity that will cement the subject matter in a way that no normal classroom Math exercise can!
This 12-page task and key is a DIY alternative to repetitive and boring Data and Statistics tasks. Students will use measures of central tendency and measures of dispersion to make real life choices about planting certain crops or not, which sports team will win a game given the weight and height of the players, etc. The product improves students' understanding of the use of the following statistics:
- mean
- median
- mode
- range
- quartile 1
- quartile 3
- Inter-Quartile Range
- Lower Outlier
- Higher Outlier
From 7th Grade math, I hardly teach these topics any more, since students know them well by now. I give them these tasks, and it takes them 2 to 3 days to complete.
You may also find these equally interesting, especially now with the Olympics!
If you enjoyed this resource, please leave a REVIEW at your leisure, for other possible buyers to know how you have experienced it. Thank you so much!
Please follow my store here to get notified of all new resources I create.
I love to improve my resources, so any constructive feedback from you will be extremely welcome.
Enjoy this resource.
By LittleStreams
This activity offers a different way to teach tally and bar graphs. Students choose 20 firework cards from the firework deck (or any amount you choose from the 45 cards). We find that 20 cards offers the most interesting collection to work with.
Students are invited to collect the data of their chosen cards and write it on the tally sheet. Finally, the students will then plot it on a bar graph.
The nature of this activity means that each student should, in theory, produce their own tally and bar graph, unique from other students in the class.
We have also included both a UK and a US version of each sheet to account for the different spelling of the word colour/color, as well as differentiated versions of the worksheets themselves for those who need a little help with matching the fireworks to the value they need to tally.
6th Grade Math Bundle | Fractions Ratio Geometry Multiplication Division Algebra
By Building Bright Brains
Are you looking for a 6th Grade Math curriculum? Check out this special bundle that includes our best-selling Sixth Grade Math Units! These Sixth Grade Math Lessons are research-based and designed specifically for Sixth grade teachers and students. This Bundle includes 13 units in the series.
What is included?
✦ 13 total lessons (561 Slides)
1. Add, Subtract, Multiplying & Dividing Integers
2. Concepts In Algebra
3. Data and Statistics
4. Division whole numbers
5. Expressions and Equations
6. Fractions Multiplication and Division
7. Geometry Booklet
8. Metric Measurement Area and Volume
9. Multiplication Whole numbers and decimals
10. Number Sense, Addition, & Subtraction
11. Number Theory and Fractions
12. percentage of a number
13. Ratio, Proportion & Percent
This Bundle is great to be used for:
- In-Classroom Teaching (Displaying for the Whole Class)
- Online Learning
- Homeschooling
- Sharing on Google Classroom or Other Platforms as a Tool for Revision
-Follow us on TeachShare to be informed with new products and updates.
Real-Life Math fun! Exciting Data and Stats Activity - Why so many white cars?
By Daniel
It is always a good strategy to review essential skills with your students.
This DIY hands-on project takes students through the process of collecting, sharing, representing and analyzing qualitative data. Students collect data on the brand, color and type of cars and then present their data in bar and circle graphs.
- Why are there so many white cars on the road?
- Why are some roads full of potholes?
- Which brand of car is the most popular in my town?
I have done this project multiple times, have "ironed out any administrative wrinkles" in the practical application of the project and it works every time. Students have a lot fun with the project. They take ownership of the project, since they collect the data themselves.
Qualitative Data, Bar Graphs, Line Graph, Circle Graph, Pie Chart, Statistics, Data, Histogram, Line Graph, Box-and-Whiskers Plot, Stem-and-Leaf Plot.
You might also not want to miss out on these other resources in the Series on Stats and Data!
If you enjoyed this resource, please leave a REVIEW at your leisure, for other possible buyers to know how you have experienced it. Thank you so much!
Please follow my store here to get notified of all new resources I create
I love to improve my resources, so any constructive feedback from you will be extremely welcome.
Enjoy this resource.
What is the Median? | Free Poster
By LittleStreams
A completely FREE poster on the Median, it's benefits and its downsides. You may also like: Mean, Median and Mode Bingo Averages Follow Me Cards Mean Wars Averages Card Game If you have any comments or suggestions, and to stay updated please follow us or take a look at our Facebook Page Please click here to visit our website for more information about LittleStreams
Statistics Part 1 | High School Math PowerPoint Lesson Slides
By Building Bright Brains
Are you teaching your High School students about Statistics? Plenty of examples and application exercises are included. You can also easily convert this to a Google Slides lesson by dragging it into your Google Drive.
What is included?
✦ 30 total slides for notes, examples and applications.
✦ All steps are animated to allow the teacher to explain them gradually.
Throughout the Lesson, students will be introduced to the following:
✦ Statistics Vocabulary
✦ Frequency , Relative Frequency , and Cumulative Frequency
✦ Graphical Representation (Bar Chart, Frequency Polygon, Circular Diagram “Pie chart”)
✦ Measures of Central Tendency (Mode, Mean, Median)
✦ Measures of Dispersion (Range, Mean Deviation, Variance, & Standard Deviation)
This resource is great for:
- In-Classroom Teaching (Displaying for the Whole Class)
- Online Learning
- Homeschooling
- Sharing on Google Classroom or Other Platforms as a Tool for Revision
To check out Statistics (Part 2) click here
-Follow us on TeachShare to be informed with new products and updates.
➵➵➵➵➵➵➵➵➵➵➵➵➵➵➵➵➵➵➵➵➵➵➵➵➵➵➵➵➵➵➵➵➵➵➵➵
Other Resources:
⤞ Vectors and Systems in Space | High School Math PowerPoint Lesson Slides
⤞ Vector Product & Vector Mixed Product| High School Math PowerPoint Lesson Slides
⤞ Vectors | Multiplication of a Vector | High School Math PowerPoint Lesson Slides
⤞ Trigonometric Lines and Circles | High School Math PowerPoint Lesson Slides
⤞ Straight Lines and Planes | High School Math PowerPoint Lesson Slides