5th Grade Statistics Resources (by date, oldest first)
FRENCH MATHS | SANS CAHIER/PAPERLESS | DIAGRAMMES/CHARTS | REPRESENTATION
By French Made Fun!
Having trouble visualizing how to "break down" math concepts and how to structure your teaching? New to this grade level or unfamiliar with "how" to teach it? Tired of passing out worksheets? If you're wanting to try something else to see if your students become more engaged and confident in math... Look no further. No book? No problem. Printer broken? No problem. Multi-levelled or split classrooms? No problem.
Imagine math classes that require zero prep, zero paper, zero planning, and slides which not only prompt your students to engage, discuss, solve and prove their understanding, but prompt you to teach concepts at a slow, realistic pace! Imagine not having to write down examples on your board and having more time to assess your students in real time. This document does just that.
This is one my paperless teaching products; where my 89-page Slide Deck will take your hand and guide you to teach following a workshop model. I provide ample explanations, examples, step-by-step instruction, assessment and answer keys. This is EXHAUSTIVE! At the end of this document, you'll find 45 pages of printable activities which can be used for assessment, revision, activities to leave with a substitute teacher.
This was created (and used!) for students in grades 5-7 and works great for older students on IEPs, students en adaptation scolaire, as revision for older grades, or for online learning. Partner work and independent work are imbedded in the slides. Students receive many guided explanations so they can work independently.
Let me teach you - and your students - how charts and data work and how to interpret and analyze statistics. This resource is 50% Slide Deck and 50% printable activities.
- The Slide Deck has been beautified and is loaded with practice, examples, conversation-starters, small group work and whole group discussions. In your Slide Deck, you will have access to:
- A collaborative revision and check-in or their prior knowledge relating to charts.
- Why we use charts, and the purpose they serve.
- The elements of a "good" chart and how to tick off those boxes!
- Analysis of "bad" charts.
- Interpreting charts based on numbers.
- How to analyse a chart for specific information (counting participants by category and total, finding preferences or "favorites," pinpointing specific values, etc).
- A look at contemporary surveys and careers in surveying.
- A whole-group co-constructed survey and data representation activity on sandwich preferences.
- Guided teaching on the construction of a chart including all elements with step-by-step instructions.
- An in-depth look at making a diagram precise and accurate (i.e. equally spaced scales on the x and y axes, how to represent "0" and how to represent data that fall "in between" the scale values.
- An explanation on counting values and totals.
- A collaborative, discussion-based activity on how charts would change if there were added values, added categories, etc.
- Independent practice creating a bar chart using data about cereal preferences.
- A partner activity on comparing charts.
- A look into other types of charts (line charts, broken line charts, pie charts).
- An explanation for continuous and discrete data.
- A simple game on continuous and discrete data (with answer keys imbedded in the slides for self-correction).
- A look into axis breaks.
In addition to the 45 pages of teachable content, games and guided instruction, there are 43 printable activities and answer keys, including :
5 math situations where students create diagrams based on data and answer questions to deepen their understanding. Among these situations, you'll find:
- A survey on electrical and gas-powered vehicles ;
- A survey about pets and kindergarteners ;
- A scholarly debate about field trips ;
- A look into the growth of a plant over 10 weeks ;
- A study into temperature changes.
11 authentic (yet fictional!) real-life situations to interpret data within diagrams. Among these activities, you'll find:
- "Sandwichs préférés des profs à l'école Paul-Martin"
- "Vote à l'échelle - président du conseil étudiant"
- "Températures à l'école la semaine passée"
- "Céréales préférées des élèves de la 3e année"
- "Vote des élèves pour un animal de classe"
- "Plats populaires au menu pour enfants de Boston Pizza"
- "Boulangeries et boucheries familiales des provinces de l'atlantique en 2021"
- "Aliments périmés dans les épiceries locales"
- "Nids de pluviers siffleurs trouvés sur les plages de l'ÎPÉ"
- "Collations préférées dans la maternelle"
- "Sports préférés des élèves de la 6e année"
This document now contains two other documents:
- Diagrammes - 5 situations
- Diagrammes - Interprétation des données
Si vous êtes intéressés par mes produits, assurez-vous de vous inscrire à ma boutique pour être averti lorsque je crée de nouveaux produits ou lance des ventes. Vous pouvez également me rejoindre sur Facebook, où je partage des cadeaux et préviens à l'avance les ventes à venir.
Merci! Je vous apprécie énormément!
- Kaitlyn.
FRENCH MATHS | CHARTS | DIAGRAMMES | REPRÉSENTATION GRAPHIQUE | SITUATIONS
By French Made Fun!
Ce document de 23 pages a récemment été mis à jour et propose désormais une enquête approfondie plus facile à imprimer et à suivre sur 5 scénarios de représentation graphique. Ce document comprend maintenant un modèle pour les élèves à créer des graphiques, des fiches de travail pour répondre aux questions relatives à leurs conclusions ainsi qu'une clé de correction pour chacun des scénarios.
Les élèves reçoivent des scénarios comprenant :
- Sondage du maire sur les véhicules électriques et à essence ;
- L'enquête d'un enseignant de maternelle sur les animaux de compagnie préférés ;
- Une dispute démocratique autour d'une sortie scolaire de fin d'année ;
- Un aperçu de la croissance de deux plantes différentes au cours de 10 semaines ;
- Une étude réalisée pour comparer la température au cours d'une journée.
Ces activités sont PARFAITES pour l'évaluation, pour la révision, pour les centres, pour un plan de remplacement ou pour les cliniques de mathématiques. Les élèves doivent créer des diagrammes à bandes ou des diagrammes à ligne brisée avec les données collectées puis répondre aux questions liées aux tables des valeurs qui les amènent à fouiller dans les données et à expliquer leurs choix. Chaque page a un scénario et une situation différents. Il y a suffisamment d'activités pour 5 cours de mathématiques!
Rejoignez mon groupeFacebook pour des cadeaux et pour vous tenir au courant des offres et des ventes.
Merci tellement pour votre support continu!
Mme. Kaitlyn
FRENCH MATHS | CHARTS | DIAGRAMMES | REPRÉSENTATION GRAPHIQUE | INTERPRÉTER
By French Made Fun!
Creating charts that are precise, effective, visually appealing and authentic is a pretty big feat! Do away with the anchor chart paper and the countless hours or prep-work and use these to amp up your teaching! I use these with my grades 5 and 6 students in my split class, but they can easily be used as Reachback or revision in grade 7 or for students needing extra exposure; like younger students who are enriched or older students who are in adaptation scolaire.
This collection of 11 charts with accompanying questions will provide your students with an authentic understanding of how and why we represent data visually. Use them as an assessment tool (and print them), or use them as a teaching and collaboration tool (and project them for discussion and exploration) - your choice how you use them!
I've taken the time to create for you 11 printer-friendly charts with titles, subtitles, legends and accompanying questions to help your students explain their understanding of charts.
In this document, I've provided a list of ways you might use this in your classroom, and 11 slides (each with a different chart and questions). Although the data I've used is fictional, they're authentic situations which provide meaningful, rich opportunities for discussion and assessment. Here are the titles of the charts you'll find in this document:
- Sandwichs préférés des profs à l'école Paul-Martin ;
- Vote à l'échelle - président du conseil étudiant ;
- Températures à l'école la semaine passée ;
- Céréales préférées des élèves de la 3e année ;
- Vote des élèves pour un animal de classe ;
- Plats populaires au menu pour enfants de Boston Pizza ;
- Boulangeries et boucheries familiales des provinces de l'atlantique en 2021 ;
- Aliments périmés dans les épiceries locales ;
- Nids de pluviers siffleurs trouvés sur les plages de l'ÎPÉ ;
- Collations préférées dans la maternelle ;
- Sports préférés des élèves de la 6e année.
I created this document to save myself time, so hopefully it's useful for others for the same reason.
If you're looking for more documents relating to charts, diagrams and graphic representation, you might also like these:
- Représentation graphique: 5 situations à résoudre.
- Enseigner les diagrammes.
Rejoignez mon groupeFacebook!
Don't forget to have fun!
Kaitlyn.

FRENCH MATHS 5-6 | ANNÉE COMPLÈTE | YEAR | JEUX, ACTIVITÉS, CONTENU, ÉVALUER
By French Made Fun!
Unlock a full year of teaching excellence with our comprehensive bundle! Perfect for both new and seasoned teachers, this collection of 68 documents provides an entire year's worth of math games, activities, worksheets, assessments and teachables. Designed for practicality, it caters to diverse teaching needs, offering a valuable resource that saves time and money. Elevate your classroom experience with easy-to-navigate, no-prep materials, ensuring dynamic and engaging lessons throughout the year. Transform your teaching game with this economical and extensive toolkit!
This bundle includes absolutely every (68!) math document you would find in my store!
Why you need this?
- These activities are built for grade six students and their all-over-the-place attitudes and personalities!
- Whether you need documents to teach content, have students show their understanding, get them up and moving, to leave with a substitute teacher or as centre-based activities, this bundle has you COVERED!
- I teach with a Workshop format and use mini-lessons. Revolutionize your teaching with our paperless resources, ideal for classrooms embracing a textbook-free approach! Streamline lessons seamlessly, fostering an interactive and digital learning environment. Upgrade your classroom experience effortlessly!
- As I build new content, games and activities, I'll add them here and update you! This is an ever-growing bundle (20 were added in 2024, alone!) (Get it sooner rather than later!)

FULL YEAR/ANNÉE COMPLÈTE BUNDLE 6E ANNÉE | ALL SUBJECTS | 130+ DOCUMENTS
By French Made Fun!
Welcome to the Mega Massive Grade 6 Bundle—your ultimate resource for an entire year's worth of curriculum! This extraordinary bundle includes 131 documents and a staggering 4,000+ pages of content, covering every aspect of Grade 6 Math, French Language Arts, Science, "Transdisciplinary" Units, Cross-Curricular Units, and Project-Based Learning.
Here's what you'll find packed into this 131 document crypt:
Language Arts:
- Complete Genre Studies: Detailed lessons and activities for all genres.
- Mini-Lessons and Workshops: Comprehensive tools for reading and writing instruction.
- Reading and Writing Prompts: Engaging activities to boost literacy skills.
- Excerpts and Writing Pieces: Diverse texts for comprehension and writing practice.
- Modelled Examples and Lesson Plans: Clear guides to support effective teaching.
- Verb and Grammar Units: Thorough resources for mastering French language skills.
- Task and Flash Cards: Interactive tools for grammar and vocabulary practice.
- Posters and Anchor Charts: Essential visual aids for classroom support.
Math:
- Paperless Teaching Slides: Digital slides for all math outcomes, ideal for projection.
- Assessments with Answer Keys: Complete evaluation tools to track student progress.
- Activities and Games: Fun, interactive ways to reinforce math concepts.
- Printable and Digital Games: Versatile resources for various teaching styles.
- Enrichment Material: Advanced content to challenge high-achieving students.
- No-Prep Lessons: Ready-to-go activities that require minimal preparation.
Project-Based Learning:
- Science and Social Studies Projects: Inquiry-based units including Dragons' Den, Sustainable Future projects, Endangered Species studies, Political Platform creation, Haunted House design, and Space Food exploration.
- Health Documents: Comprehensive materials on sexuality, puberty, and other health topics.
- Themed Day Content: Engaging projects for Orange Shirt Day, Pink Shirt Day, Remembrance Day, Earth Day, and a project on O Canada.
Why You'll Love It:
- Massive Content Collection: Over 4,000 pages and 131 documents covering every subject.
- No-Prep, Ready-to-Go: Perfect for busy teachers and easy to leave with a substitute.
- Engaging and Comprehensive: Promotes student independence with project-based and inquiry learning.
- Constantly Growing: New materials added regularly to keep your curriculum up-to-date.
- Versatile and Easy to Use: Printable and digital formats for flexible teaching options.
Get the Mega Massive Grade 6 Bundle today and transform your classroom with this all-encompassing resource, designed to make planning easier and teaching more effective!
** Buying these individually would cost you WELL over $530 USD (that's like OVER $725 CAD). So save yourself time and money and get ready for the next school year! **
Join me on Facebook! I share freebies, keep you up-to-date on sales and deals and welcome your collaboration and feedback.
You can earn TeachShare CREDITS by leaving feedback on any of the products you purchase. You can do so by going to MY PURCHASES your page and clicking on the "Provide Feedback" button. You will earn 1 TeachShare Credit for every dollar you spend!
For goodness sakes, don't forget to have fun!
Mme Kaitlyn
Data and Statistics | 6th Grade PowerPoint Math Lesson Slides | Circle Graphs
By Building Bright Brains
Are you teaching your students about Data and Statistics For 6th Grade? Plenty of examples and application exercises are included. You can also easily convert this to a Google Slides lesson by dragging it into your Google Drive.
What is included?
✦ 9 total slides for notes, examples and applications.
✦ All steps are animated to allow the teacher to explain them gradually.
At the end of the lesson, students will be able to
✦ Interpret Circle Graphs.
✦ Use a circle graph to complete s table.
✦ Use a circle graph to answer questions.
This resource is great for:
- In-Classroom Teaching (Displaying for the Whole Class)
- Online Learning
- Homeschooling
- Sharing on Google Classroom or Other Platforms as a Tool for Revision
-Follow us on TeachShare to be informed with new products and updates.
➵➵➵➵➵➵➵➵➵➵➵➵➵➵➵➵➵➵➵➵➵➵➵➵➵➵➵➵➵➵➵➵➵➵➵➵
More Related Products:
⤞ percentage of a number | 6th Grade PowerPoint Lesson Slides
⤞ Concepts in Algebra | 6th Grade PowerPoint Lesson Slides | Algebraic Patterns
⤞ Metric Measurement Area and Volume | 6th Grade PowerPoint Lesson Slides
⤞ Ratio Proportion & Percent | 6th Grade PowerPoint Lesson Slides
⤞ Fractions | Multiplication & Division | 6th Grade PowerPoint Lesson Slides
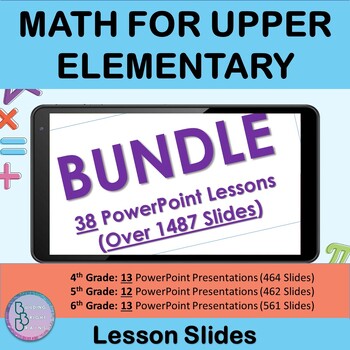
Math Bundle for Upper Elementary | PowerPoint Presentation Lesson Slides
By Building Bright Brains
Are you looking for a Math Bundle for Upper Elementary? Check out this special bundle that includes our best-selling For Fourth, Fifth, and Sixth Grade Math Units! These Lessons are research-based and designed specifically for upper elementary teachers and students.
What is included?
✦ This Bundle includes 38 PowerPoint Lesson Slides (Over 1480 Slides)
4th Grade
1. Addition and Subtraction with and without Regrouping
2. Decimals
3. Divide By One Digit
4. Divide By Two Digit
5. Fractions
6. Fractions Addition and Subtraction
7. Geometry
8. Get Ready For Algebra
9. Measurement and Metric System
10. Multiplication
11. Place value to Thousands and Millions
12. Probability and Statistics
13. Solid Figures and Polygons
5th Grade
1. Algebraic Expressions & Equations
2. Decimals and Place Value
3. Division
4. Fractions Addition and Subtraction
5. Geometry
6. Geometry Booklet
7. Metric Measurement Area and Volume
8. Metric Units of Capacity
9. Multiplication
10. Multiplication and Division
11. Number Theory and Fractions
12. Place Value, Addition, And Subtraction
6th Grade
1. Add, Subtract, Multiplying & Dividing Integers
2. Concepts In Algebra
3. Data and Statistics
4. Division whole numbers
5. Expressions and Equations
6. Fractions Multiplication and Division
7. Geometry Booklet
8. Metric Measurement Area and Volume
9. Multiplication Whole numbers and decimals
10. Number Sense, Addition, & Subtraction
11. Number Theory and Fractions
12. percentage of a number
13. Ratio, Proportion & Percent
This Bundle is great to be used for:
- In-Classroom Teaching (Displaying for the Whole Class)
- Online Learning
- Homeschooling
- Sharing on Google Classroom or Other Platforms as a Tool for Revision
-Follow us on TeachShare to be informed with new products and updates.
6th Grade Math Bundle | Fractions Ratio Geometry Multiplication Division Algebra
By Building Bright Brains
Are you looking for a 6th Grade Math curriculum? Check out this special bundle that includes our best-selling Sixth Grade Math Units! These Sixth Grade Math Lessons are research-based and designed specifically for Sixth grade teachers and students. This Bundle includes 13 units in the series.
What is included?
✦ 13 total lessons (561 Slides)
1. Add, Subtract, Multiplying & Dividing Integers
2. Concepts In Algebra
3. Data and Statistics
4. Division whole numbers
5. Expressions and Equations
6. Fractions Multiplication and Division
7. Geometry Booklet
8. Metric Measurement Area and Volume
9. Multiplication Whole numbers and decimals
10. Number Sense, Addition, & Subtraction
11. Number Theory and Fractions
12. percentage of a number
13. Ratio, Proportion & Percent
This Bundle is great to be used for:
- In-Classroom Teaching (Displaying for the Whole Class)
- Online Learning
- Homeschooling
- Sharing on Google Classroom or Other Platforms as a Tool for Revision
-Follow us on TeachShare to be informed with new products and updates.
Mean Median Mode Range Color by Answer / Color by Number
By Kile's Classroom
Practice the skill of solving averages with this fun activity. The students solve for mean, median, mode, and range and search for the answer on the coloring page. If the answer is not there, they have made a mistake! Perfect for self correction and error analysis! Check out the full product preview! ************************************************************* Check out more great products from Kile's Classroom! Dividing Fractions and Whole Numbers Color By Answer. Dividing Fractions Color By Answer. Decimal Operations Color By Answer.

Mean, Median, Mode and Range Bundle- Guided Notes, Engaging Activities, and More
By Kile's Classroom
A huge bundle of activities - everything you need to teach Mean, Median, Mode and Range!
This bundle includes:
Guided Notes
Anchor Charts
Partner Practice Activity
Dice Game
Problem Trail
Color By Answer
Check out the preview and individual products for more details!
************************************************************************************
More Resources from Kile's Classroom
Measurement
4-6th grade Reading Skills
Decimal Operations

Math Skills Color By Answer Upper Elementary Math Skills Practice Bundle
By Kile's Classroom
Upper Elementary Math Color by Answer Bundle
A FULL YEAR of self-checking math skills practice!
A fun way to practice or review math skills! Perfect for practice and review of 5th grade math skills, or great remediation practice for students that are struggling!
Students color the answers of their math problems, but if the answer is not there, they made a mistake! Instant feedback is great for students!!
31 different coloring activities that are engaging and fun!
These activities sell for $2.70 or more each. Save BIG with with bundle!
Skills Include:
.- Long Division
. - Add and subtract fractions with unlike denominators
. - Add and subtract mixed numbers with like denominators
.- Decimal multiplication
. - Decimal Addition and Subtraction
.- Mixed Decimal Operations
. - Exponents and powers
. - Multiplication of 2 and 3 digit numbers
. – Mean, median, Mode, and Range
. – Area of Polygons
– Dividing Fractions and whole numbers
. Dividing Mixed Numbers
. Dividing Fractions
. Mixed Operations with Decimals
-Metric Measurement Conversions
- Customary Measurement Conversions
.LCM and GCF
. Decimal Division
*****************************************************************************
More Great Products from Kile's Classroom
Decimal Number Lines.
Decimal Interactive Notebook Pages.
5th Grade Math Interactive Notebook Pages.
**********************************************************
Customer Tips:
How to get TeachShare credit to use on future purchases:
• Please go to your My Purchases page (you may need to
login). Beside each purchase you'll see a Provide Feedback button.
Simply click it and you will be taken to a page where you can give a quick rating and
leave a short comment for the product. Each time you give feedback, TeachShare gives you
feedback credits that you use to lower the cost of your future purchases. I value your
feedback greatly as it helps me determine which products are most valuable for your
classroom so I can create more for you. ☺
Be the first to know about my new discounts, freebies and product launches:
• Look for the green star next to my store logo and
click it to become a follower. Voila! You will now receive email updates
about this store. ☺
*****************************************************************************5th grade math skills, 4th grade math skills, review, color by number, color by answer, adding, decimals, fractions, multiplication, division
Check The Temp - Measuring the Median
By YourTeachingDoc
The Median can be a difficult concept for students to master. A relevant approach to teaching the statistical value of the Median is to have students determine the High and Low temperatures of the weather for a week. To facilitate this, a worksheet has been designed as an easy way to integrate extra practice during Bell Ringers or Warm-Up activities.
Get Sporty with Interquartile Ranges
By YourTeachingDoc
Do you need help teaching your students about the "middle 50" in a data set? Introduce Interquartile Ranges in a fun and engaging way with this worksheet. Students will analyze the scores of the two teams and determine which has the best point spread. You can even customize the teams to feature your favorites!
♯ Please review TOU before purchasing.
Be sure to look at the Preview and Thumbnails to ensure this activity aligns with your students/curriculum. If you have any questions, please contact me HERE BEFORE purchasing any item in my store so I can ensure you are satisfied with your purchase.
♯ HOW TO GET TeachShare CREDITS ON FUTURE PURCHASES:
- Go to MY PURCHASES page.
- You will see a PROVIDE FEEDBACK button.
- Please leave a star rating and a comment. This will help lower the cost of future purchases!
Fractions, Decimals & Percentages Card Game
By LittleStreams
This is a fun and engaging game aims to reinforce the skills required to identify equivalent fractions, as well as their corresponding percentage and decimal values.
There are 6 types of card in this pack, Black cards which feature simple fractions, Green cards which are their basic equivalent fractions, Red cards which are more difficult equivalent fractions, Purple cards which feature visual representations of equivalent fractions, Yellow cards which feature equivalent percentage values and Blue cards which feature equivalent decimal values.
Full rules and answer key are provided in the pack itself. The cards are also printed with easy-cut guides to make preparation fast and simple.
This product is available as part of a Card Game Bundle of 5 games for the price of 3. For savings, click to see.
You may also like:
Fractominoes 2 - Fraction, Decimal and Percentage Dominoes
Fraction, Decimal and Percentage Flash Cards
Fractions, Decimals and Percentage Clip Cards
Fractions, Decimals and Percentage Matching Activity
Decimal Snakes and Ladders Board Game
If you have any comments or suggestions, and to stay updated please follow us or take a look at our Facebook Page
Please click here to visit our website for more information about LittleStreams
By LittleStreams
A card game that provides a fun way to reinforce the knowledge of averages. The cards give students an interactive way to develop a deeper understanding of Mean, Median, Mode and Range data.
Pack includes a set of 52 cards of numbers 0 to 12. Full rules of play are included, and the cards are printed with easy-cut guides to make preparation fast and simple.
This product is available as part of a Card Game Bundle of 5 games for the price of 3. For savings, click to see.
You may also like:
Mean, Median and Mode Bingo
Chance of Rain Probability Card Game
If you have any comments or suggestions, and to stay updated please follow us or take a look at our Facebook Page
Please click here to visit our website for more information about LittleStreams
This resource is on sale for 5th July only as part of a special promotion. Find more deals for grades K-12 and information about giveaways here!
Matching Puzzle - Graphs and Charts
By LittleStreams
This statistics graphs 4-piece puzzle is a fun way to test students ability interpret data. Students match the images of fruit to the frequency table and two graph representations (pie charts and bar graphs). It is designed to be easily cut with little wastage. So either the teacher or tutor can prepare the cards by cutting them before hand, or students can cut their own cards, giving them a chance to see the solutions before they attempt the puzzle. Although this product is made in colour, it prints perfectly well in black and white. Each puzzle is the size of an A4 of US Letter sheet. To use less paper, select the pages per sheet option, and the puzzles will be smaller, but still high quality.
By LittleStreams
A great end of year, seasonal game that still has educational merit. Suitable for all ages. This game is available in a 5 for 3 bundle. It is a game designed to explore probabilities, and how they change as time goes on. But can also be played just for fun as a way to develop strategic thinking. There are varied numbers of weather cards, and you use your knowledge of their probabilities to prepare yourself with items to go out in that weather. If a rain card is turned over, and you are prepared with an umbrella, well done! You keep your Item. But if a sunny card is turned over, and you have an umbrella, oh no! You lose your item. The winner is the last person to remain in the game at the very end. The game is playable in 2 different ways, independent and dependent probabilities, as defined by removing completely or returning and reshuffling the weather cards as you play. Both give great play experiences. We have already played this game with tutees, and they say it's our best game so far! Purchase it to find out why. It comes with easy-cut guides, full cheat sheets and probability tracking pages for players to keep track as cards are played and revealed. Makes for great fun, and powerful learning. This card game is also available in a bundle of 5 games for the price of 3. For savings, click here to see. If you have any comments or suggestions, and to stay updated please follow us or take a look at our Facebook Page Please click here to visit our website for more information about LittleStreams
Statistics Bingo for Mean, Median & Mode
By LittleStreams
This product is available in a discounted 5 game bundle. Click here to see.
This game contains bingo cards and 54 question cards that contain a series of numbers for players to work out mean, median and mode.
This game is an easily printed and prepared thanks to easy-cut guides. It comes with well-explained rules of play, and makes a great time filler for an entire class or a high quality game for one on one tuition. Download the PDF preview now to see the game up close.
We also have Mean Wars Card Game
We love getting feedback. Don't forget to rate us and leave feedback, and you will receive TeachShare credits to put toward future purchases.
----
If you have any comments or suggestions, and to stay updated please follow us or take a look at our Facebook Page
Please click here to visit our website for more information about LittleStreams
Pie Charts Drawing & Interpreting (Worksheets and Scavenger Hunt)
By LittleStreams
#freebiefriday
This free download is brought to you in collaboration with LittleStreams and it combines two fully differentiated resources covering drawing, reading and interpretation of pie charts.
The first is a pack of six worksheets by LittleStreams the first four are of increasing difficulty drawing pie charts from tables and another two worksheets of increasingly difficulty drawing pie charts from bar charts. Solutions are provided for each worksheet. The second pack in this free download is a treasure hunt on reading and interpreting pie charts, it is differientated to three levels were the green (hardest) level is suitable for GCSE Higher. Each level consists of ten questions. Again the solutions are provided for teacher reference.
You may also enjoy
Pi Day Bundle
Geometry Task Cards
Terms of Use
Download is for the use of one teacher only.
Methods of Data Analysis | Poster on Mean, Median, Mode and Range
By LittleStreams
This is a simple and completely FREE poster on the four common methods of data analysis. It states simply how to find each. You may also like: Mean, Median and Mode Bingo Averages Follow Me Cards Mean Wars Averages Card Game If you have any comments or suggestions, and to stay updated please follow us or take a look at our Facebook Page Please click here to visit our website for more information about LittleStreams