Graphing Activities
GRAPHING AND DATA COLLECTING!! My Temperature Blanket (Fahrenheit)
By La Llama Bilingüe
There is also a Celsius version!
GUILTY!! I have tried to crochet a temperature blanket more than once but I never seem to finish them. That's why I have created this fun and unique resource for your classroom! Easier than crocheting :P !!!
A PERFECT ACTIVITY FOR YOU MORNING ROUTINE!!!
With this product, your class will be able to track daily temperatures and record them in a blanket template.
This document includes:
- 2 "How to" pages
- 3 Thermometer Template Pages (with and without temperature ranges)
- A Cover Page
- 1 Temperature Blanket Template
- Data Analysis Pages (1 for every month Sep-Jun)
- 6 Compare and Contrast pages.
With this activity pack kids will learn and use different kinds of skills, such as counting, subtracting, collecting, analyzing, comparing, contrasting, reflecting, etc.
Easter Graphing Worksheets First Grade
By Primary Piglets
Get ready for some Easter Graphing!
Less hassle than graphing jelly beans, these pages are perfect for Spring just Print & Go! Students love "Spin & Graph" pages, they are fun & engaging. This is a set of 8 pages of graphing practice Easter themed. 4 pages are "Spin & Graph", the other 4 are "Count, Tally & Graph pages."
❤️ FOLLOW ME, PRIMARY PIGLETS and grab the latest freebies and deals!
Related Products
❤️ Easter Directed Drawings Boom Cards
❤️ Color by Number Easter Bundle
❤️ Color by Number Math Facts ALL YEAR BUNDLE
❤️ Addition and Subtraction Color by Number ALL YEAR
❤️ Color by Number ALL YEAR Bundle
There are 4 Count, Tally & Graph Pages in each Set: Students color by picture, then count and tally in spaces provided. Then color in graph to show data.
There are 4 Spin & Graph Pages in each Set: Students use a paperclip and pencil to spin. Color in the graph each time you spin until one of the pictures reaches the top of the graph. Look over your data and write an "I noticed..." statement. Examples; I noticed there were more bells than trees. I noticed there were 3 more blank than blank. I noticed the blank were the least.
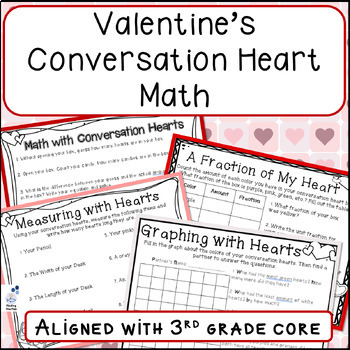
Valentine's Conversation Hearts Math: Fractions, Measurement, Graphs, Rounding
By E•Fish•ient Teaching
This is a perfect math bundle for Valentine's Day. It is aligned with the 3rd grade core, but could be used for any grade 3rd or higher. All you need to do these math pages is a box of conversation hearts for each student.
- There are 2 pages, Math with Conversation Hearts, that have students estimate, round, and make patterns with their hearts in their box.
- There are 2 pages, A Fraction of My Heart, where students will write down the fraction of the different colors and sayings in their conversation box. Then they will answer questions about their fractions.
- There are 2 pages, Graphing with Hearts, where students will graph the different colors they find in their box and also graph the different sayings in their box. Then there are a few questions to answer about their graphs.
- The last page is, Measuring with Hearts, where students will use their hearts to measure different items listed on their page.
This is a simple go to lesson for practicing math skills. It is perfect for Valentine's Day and no prep.
If you enjoyed this product, please leave a review and follow my store. If you would like to see more products by me follow the link Finding the Fish. Thank you for your purchase and I hope you enjoy!

Fall Coordinate Grid Mystery Pictures Bundle- Halloween Coordinate Plane
By Modified Treasures
Bring a little Halloween fun to your math classroom with this Spooky Halloween Coordinate Grid Picture Bundle! This set of fall coordinate grid pictures include: Witch, Dracula, Frankenstein, Pumpkin Man, Monster and a Scarecrow. Each resource comes with two versions to accommodate different levels: a 1st quadrant version for beginners and a 4-quadrant version for more advanced students.
This bundle is perfect for reinforcing graphing skills, plotting points, and practicing coordinate geometry while adding a festive twist. Ideal for math centers, individual practice, or holiday-themed activities, these spooky designs will keep your students motivated and excited to learn.
What's Included:
6 Halloween-themed images:
- Witch
- Frankenstein
- Pumpkin Man
- Scarecrow
- Dracula/Vampire
- Monster
Each image comes in:
- 1st quadrant (positive coordinates only)
- 4-quadrant (positive and negative coordinates)
Great for students who are working on plotting points, understanding coordinates, and building graphing confidence, all while getting into the Halloween spirit!
Graphing for Second and Third Grade
By Science and STEAM Team
This data collection and graphing resource includes standards, tips and suggestions, and a variety of graphing activities. These include tally, bar, and pictographs. Students will conduct their own surveys using questions from an age-appropriate list (or they can develop their own) and graph their findings. They will also learn the importance of looking for a key. The pages in this packet can be used to introduce graphing, or they can be used as a review at the end of a unit or before state exams.
❤️**Click Here to Follow Us!**
Related Products
⭐ Math Award
⭐ Measuring Mass Using a Pan Balance and Gram Weight for Lower Elementary Grades
⭐ Test Prep: Measuring Mass Using a Pan Balance for Upper Elementary Grades
⭐ Second Grade NGSS: Bundle of Science Units for the Whole Year!
⭐ Summer Color by Code for Second Grade Review
⭐ Third Grade NGSS: Bundle of Science Units for the Whole Year!
⭐ Family STEM Night All-Inclusive Package!
⭐ Family STEM/STEAM Challenges with SAMMIE STEAM!
Customer Tips:
How to get TeachShare credit to use towards future purchases:
*Please go to your My Purchases page (you need to login). Next to each purchase, you’ll see a Provide Feedback button. Click that and you will be taken to a page where you can give a rating and leave a short comment about the product. Each time you give feedback, TeachShare gives you credit that you can use towards your future purchases.
Graphical Representations Project - Application Assessment
By Ms Churchs Classroom
This project focuses in on students abilities to collect and represent their data, with ownership tied in by making it easy to represent their homes. Students will collect and display their data in a brochure format by pretending to be marketing managers for their locations!
Teachers can also choose a variety of locations (make it video game themed perhaps!) to help excite students.
Great to tie-cross curricular with writing goals!
___________________________________________________________________
If you are looking for other math applications, check out my other projects here!
- Borrowing Money
- Understanding Savings
___________________________________________________________________
If you enjoyed this resource, I would LOVE a review and you will earn TeachShare credit for your feedback.

Best Real Life Math! Practical Data and Statistics activities, Tasks with keys
By Daniel
A wonderful Real-Life Math bundle with lots of practical applications.
These projects and tasks, (with keys), make Data and Statistics come alive. They are tried, tested and improved over many years in my middle school classroom. Students get to think about concepts such as mean, median, range, mode, quartiles and outliers in a real life and practical way. The products include both quantitative and qualitative data and the statistics involved. Both the measures of central tendency and measures of dispersion are covered.
The products can be used
- at the start of the unit on data and statistics
- as an end of unit project
- as an assessment.
- for groupwork
You might also find these equally interesting, now in Olympics time!
If you enjoyed this resource, please leave a REVIEW at your leisure, for other possible buyers to know how you have experienced it. Thank you so much!
Please follow my store here to get notified of all new resources I create.
I love to improve my resources, so any constructive feedback from you will be extremely welcome.
Enjoy this resource.
By LittleStreams
This activity offers a different way to teach tally and bar graphs. Students choose 20 firework cards from the firework deck (or any amount you choose from the 45 cards). We find that 20 cards offers the most interesting collection to work with.
Students are invited to collect the data of their chosen cards and write it on the tally sheet. Finally, the students will then plot it on a bar graph.
The nature of this activity means that each student should, in theory, produce their own tally and bar graph, unique from other students in the class.
We have also included both a UK and a US version of each sheet to account for the different spelling of the word colour/color, as well as differentiated versions of the worksheets themselves for those who need a little help with matching the fireworks to the value they need to tally.
Math Activity: Winter Sweaters Graphing
By Inspired By MlG
Math Activity: Winter Sweaters Graphing
Cut, Color, Graph, and Calculate! ❄️
This engaging math activity is perfect for early learners. Students will cut out and color a winter sweater and its ornaments. Then, they'll create a graph to represent the number of each ornament they used. Finally, they'll calculate and write down the total number of ornaments. This activity helps develop counting skills, graphing abilities, and basic math operations in a fun and festive way.
☺ Earn TeachShare credits for future purchases by providing feedback for paid products. (Feedback on free products is also greatly appreciated!)
☺ Follow me to receive notifications when new products are posted. You will also receive occasional messages alerting you to sales, promotions, and other exciting news.
☺ Don’t quite see what you are looking for? Leave me a note in the “Ask a Question” tab. I would be happy to create a product to meet the needs of you and your students.
⭐Questions? Send me an email at
Coordinate Plane Graphing Battleship One Quadrant Four Quadrant Plotting Numbers
By Dotty's Printables
This is a set of Coordinate Plane Graphing Battleship grids designed for students to practice plotting points while playing a fun game. The set includes:
- Basic grid with one quadrant for beginners
- Advanced grid with four quadrants for more experienced students
- Grids labeled with letters on the Y-axis and numbers on the X-axis
- Space for students to place their ships and track enemy ships
- Simple rules to mark hits and misses
By May
An escape room for your classroom to review graphing skills! Students can practice graphing points, labeling, naming points, and thinking creating a sketch through coordinates!
What's included:
- Escape Room Tasks
- Group Trackers
- Escape Room Clues
- Aiding Materials (Note to the Detective, Map of the house, Detective Notes)
- Detective License "Exam"
- Detective IDs
- Classroom Decorations (Foot Prints, Shoe Prints, Team Cards)
Apple Seed Graphing and Counting
By Rebekah Poe Teaching
Students will count and graph the number of apple seeds they found in their apples. Excellent for early elementary and special education classrooms. Black and white graphics help you save on ink. Easy, fun, and interactive math lesson. Lesson plan ties in Special Education Extended Standards. This would be fun for Johnny Appleseed Day!
Parallel and Perpendicular Lines Scavenger Hunt
By Chimp-a-roo Maths
In this scavenger hunt, students are given a line and a point. They either need to find the equation of a line parallel or perpendicular to that line through the given point. Equations are given as either y = mx + b or ax + by = c
• Print off the twenty question pages and put them up around the room
• Each question is in the middle of the page and the solution is at the top of another page.
• A student begins on a given question, solves it and finds the answer on another sheet. The question on this sheet will be the next question they answer. Once they have answered all twenty, they will return to their starting question
• Depending on numbers, students can all start on different questions
• There is a student answer sheet included plus the correct sequence
LICENSING TERMS: This purchase includes a license for one teacher only for personal use in their classroom. Licenses are non-transferable, meaning they cannot be passed from one teacher to another. No part of this resource is to be shared with colleagues or used by an entire grade level, school, or district without purchasing the proper number of licenses.
COPYRIGHT TERMS: This resource may not be uploaded to the internet in any form, including classroom/personal websites or network drives, unless the site is password protected and can only be accessed by students.
Comparing Linear Functions: Grade 8 Math
By EZMath
Want to know if your 8th grade math students can compare linear functions in the same a different representation?
This presentation includes 10 questions (23 slides total) that has students work in groups to determine which linear representation matches the given statement. Students compare linear functions in tables, graphs, equations, and scenarios to differentiate between highest and lowest initial value and rate of change.
Great as a review activity before an exam, or as a mid-unit formative assessment to track progress towards mastery.
This lesson also includes a quick paper/pencil exit ticket students can do individually so you can assess each students' mastery, with answer key included.
Included in Activity:
- Link to Google Slide Deck for classroom presentation
- Complete directions for how I like to run the activity
- Printable student answer choice cards
- Printable student Exit Ticket
- Complete Exit Ticket solutions
If you enjoy this activity, please check out my Level Up products, or my Team Target Review series, which encourages group work and rich math discussion.
Check out my blog at EZMathBlog or follow me on Twitter, Instagram, or Threads.
Blank Editable Bar Graph Worksheet Template for Primary & Kindergarten
By The Students Palace
WHAT YOU WILL RECEIVE
9 Pages
PPTX FILE
PDF FILE
PNG FILES
Large 8.5'' x 11'' designs that can easily be printed on regular sized paper
High-resolution images
Unlimited prints
Great for kids, boys and girls
JUST DOWNLOAD, PRINT AND GET STARTED
This item comes as a high-resolution ZIP file that you can download straight after purchasing.
You can print as many copies as you want.
NOTE
This is a digital item.
No physical product or printed material will be shipped.
No refunds as this is a digital product.
Follow me from Here .
#onedollarwave Alphabet Soup Graphs Upper & Lowercase letters, K-1
By Regina Frazier
Students will have fun looking for letters in the alphabet soup and writing them on the graphs for both uppercase and lowercase letters. Since I follow the Scott Foresman Reading Series, the letters are introduced on the graph in the same way they are presented in the series. However, you could use these graphs with any reading series as it prepares students with important letter identification skills that all kindergarten students will need. Students get some math and literacy practice with this activity. Included in this file are all letters. There are five graphs for uppercase letters and five graphs for lowercase letters. There are four additional mixed upper and lowercase letter graphs. You will also receive a blank graph and bowl so the teacher or students can create their own. This activity allows you to differentiate the instruction to meet the needs of your students. Just print and go and enjoy this fun integrated math and literacy activity with your students.
You may be interested in the following:
Alphabet Posters Lined Zaner Bloser Directional Arrows Start Points
Number Formation Poems Practice Sheets
Color Word Crayons Activities and Posters in English and Spanish
Beginning Sounds School Bus Sort
Making Wise Choice Desk Incentives Writing Prompts
You can purchase this product along with all the previous products mentioned in this back to school bundle to save 24% off.
Back to School Kindergarten Bundle Pack
**************************************************************************
Thanks for looking. Please check out my store. I have many high quality learning experiences that align with the Common Core. If you like what you see, please consider becoming a follower by clicking on the green star. You will be aware of new products, and upcoming sales. Check out my blog at http://123kteacher.blogspot.com/
Here you will find motivating, fun ideas and interesting ways to teach young children. From time to time, I may be hosting a few giveaways. Don't miss out on this great opportunity.
Marshmallow Graphing for Saint Patrick's Day
By Jennifer Connett
Use your favorite marshmallow cereal to make a fun St. Patrick's Day graphing activity! Students will practice graphing skills by sorting a handful of marshmallows on their graphing paper. A recording page is available for students to work with the data on their graph.
Students will gain practice in sorting, counting, addition skills and comparing numbers in a set with this Saint Patrick's Day math activity. This activity can be done in a math center, whole group activity, small group activity or just a fun snack time learning activity.
There are three sets of marshmallow graphs and recording pages to accommodate different boxes of cereal.
More St. Patrick's Day Activities
St. Patrick's Day Addition
St. Patrick's Day Subtraction
Valentine's Day Math Worksheets | Graphing Fun!
By Jessica
This Valentine's Day math activity is perfect for practicing counting and making basic graphs.
**✨**Take a peek at the preview to get a closer look.
WHAT IS INCLUDED?
- 10-page PDF file
- Instructions
- A Valentine's Day-themed search and find game (with everyone's favorite tumbler!)
- 4 different versions graph paper
- Additional math worksheet for questions about the search and find game.
- Extra reverse graphing activity.
HOW IT WORKS
1. Easily print the resource from your computer.
2. Discuss each object in the picture, talking about colors, if they like it, etc.
3. Tell the students to find all of the objects hidden in the picture and then write how many there are of each on the line next to each object at the bottom of the page.
4. The remaining pages are a math graph activity to teach the students how to make and read graphs.
5. Use the black and white version if you want the students to color the graphs themselves.
WHO IS IT FOR?
- Elementary School Teachers: You'll love this as a resource for your students to practice counting and drawing graphs while having fun!
- Homeschooling Parents: This is the perfect resource to lay a foundation of graph knowledge for your kiddo.
FEATURES
- Each page is 8.5" x 11", but you can adjust this in your printer settings.
- Colorful sheets
- Instructions
Grade 3 Graphing Activity Standardized Test Prep Digital Resource Create Graphs
By For the Love of Learning in Third
Graphing practice for standardized testing such as SBA, CAASPP, FAST, PARCC, NYS etc. Creating / reading graphs / 2 part questions. Bar graphs, line plots & pictographs
CCSS aligned to grade 3 math standards 3.MD.3 & 3.MD.4
This resource include a printable PDF and digital made for Google Slides options. There are 2 pages for each type of graph: line plots, bar graphs, picture graphs / pictographs. Great for differentiation!
The made for Google Slides option includes a fixed background so students can not move it and drag and drop tools for students to complete the graphs.
Includes a variety of question types for students to answer using data from the graphs- see preview.
Please leave feedback for this product to receive TeachShare credit that can be used for future purchases!
Permission is granted to copy pages for use by teachers/students use by the original purchaser. This product was sold for single classroom use only. Please purchase additional licenses for use in multiple classrooms.
Unplugged: Math Games and Worksheets Graphing Random Points Using Dice
By Howlin' Husky Math Games
Introducing Graphing Random Points Using Dice, an innovative and engaging math activity that’s perfect for adding excitement to your classroom!
In this worksheet, students use uniquely shaped dice—tetrahedrons and decahedrons—to generate random points on a graph, creating an unpredictable and fun learning experience. This hands-on activity helps students practice graphing coordinates while incorporating creative thinking as they connect points to form shapes, pictures, or even transform their graphs into city maps. Whether it's developing their geometry skills by creating triangles or determining slopes, students will enjoy learning through play.
This resource is ideal for teachers seeking to make math more interactive. It can be used as an engaging math center activity, a group exercise, or even a challenge-based lesson. With options to customize what students do after plotting their points, you can tailor it to fit your classroom's needs. Plus, the included printable dice add an extra layer of fun! Get ready to inspire creativity and reinforce key graphing skills with Graphing Random Points Using Dice,