Statistics PowerPoint Presentations

6th Grade Game Show Review Games BUNDLE
By The M-Intercept
These games are the perfect way to review your units throughout the year. My students absolutely love playing jeopardy before their unit tests. The academic conversations among groups deepen knowledge and the game show format increases motivation and engagement.
**FULLY EDITABLE** While the games are complete, it is also editable in PowerPoint, making it easy to add questions or change the level of difficulty based on your students' needs.
This bundle includes SIX games for the price of FIVE. The games include:
RATIOS AND PROPORTIONS, NUMBER SYSTEMS, EXPRESSIONS AND EQUATIONS, GEOMETRY, STATISTICS AND ALL STANDARDS.
**Prefer the individual games or want to look at them further?**
Ratios and Proportional Relationships Game Show Review
Number Systems Game Show Review
Expressions and Equations Game Show Review
Geometry Game Show Review
Statistics Game Show Review
6th Grade All Standards Review Game – perfect for state testing and the end of the year!
6th Grade - Statistics - Median and Interquartile Range
By Chimp-a-roo Maths
Finding the median, quartiles and interquartile range from a list of data.
- PowerPoint with examples for odd and even numbers of data
- Worksheet on finding the median and interquartile range from data lists. Comparing data using medians and interquartile ranges
- Worked solutions included
LICENSING TERMS: This purchase includes a license for one teacher only for personal use in their classroom. Licenses are non-transferable, meaning they cannot be passed from one teacher to another. No part of this resource is to be shared with colleagues or used by an entire grade level, school, or district without purchasing the proper number of licenses.
COPYRIGHT TERMS: This resource may not be uploaded to the internet in any form, including classroom/personal websites or network drives, unless the site is password protected and can only be accessed by students.
Math Bundle for Upper Elementary | PowerPoint Presentation Lesson Slides
By Building Bright Brains
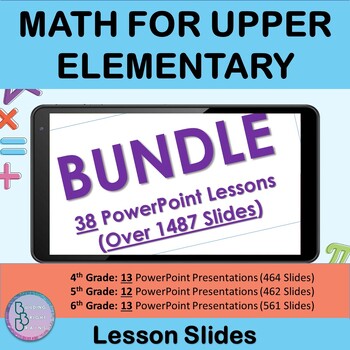
Are you looking for a Math Bundle for Upper Elementary? Check out this special bundle that includes our best-selling For Fourth, Fifth, and Sixth Grade Math Units! These Lessons are research-based and designed specifically for upper elementary teachers and students.
What is included?
✦ This Bundle includes 38 PowerPoint Lesson Slides (Over 1480 Slides)
4th Grade
1. Addition and Subtraction with and without Regrouping
2. Decimals
3. Divide By One Digit
4. Divide By Two Digit
5. Fractions
6. Fractions Addition and Subtraction
7. Geometry
8. Get Ready For Algebra
9. Measurement and Metric System
10. Multiplication
11. Place value to Thousands and Millions
12. Probability and Statistics
13. Solid Figures and Polygons
5th Grade
1. Algebraic Expressions & Equations
2. Decimals and Place Value
3. Division
4. Fractions Addition and Subtraction
5. Geometry
6. Geometry Booklet
7. Metric Measurement Area and Volume
8. Metric Units of Capacity
9. Multiplication
10. Multiplication and Division
11. Number Theory and Fractions
12. Place Value, Addition, And Subtraction
6th Grade
1. Add, Subtract, Multiplying & Dividing Integers
2. Concepts In Algebra
3. Data and Statistics
4. Division whole numbers
5. Expressions and Equations
6. Fractions Multiplication and Division
7. Geometry Booklet
8. Metric Measurement Area and Volume
9. Multiplication Whole numbers and decimals
10. Number Sense, Addition, & Subtraction
11. Number Theory and Fractions
12. percentage of a number
13. Ratio, Proportion & Percent
This Bundle is great to be used for:
- In-Classroom Teaching (Displaying for the Whole Class)
- Online Learning
- Homeschooling
- Sharing on Google Classroom or Other Platforms as a Tool for Revision
-Follow us on TeachShare to be informed with new products and updates.
2023 Virginia AFDA SOL "I Can" Statements
By Candy Apple Class Aids
2023 Algebra, Function, and Data Analysis Virginia SOL "I Can" Statements
Say goodbye to writing daily objectives on the board! Simply print, cut, and laminate these "I Can" statements and post on your board to display daily learning goals. The statements are available in full letter, half-sheet, and quarter-sheet sizes.
There are 53 essential knowledge and skills from the 2023 Algebra, Functions, and Data Analysis Virginia SOL curriculum framework are included in this product.
✨Happy Teaching!✨
Check out these other resources:
2023 Math 7 Virginia SOL "I Can" Statements
2023 Math 8 Virginia SOL "I Can" Statements
2023 Algebra 1 Virginia SOL "I Can" Statements
2023 Geometry Virginia SOL "I Can" Statements
2023 Algebra 2 Virginia SOL "I Can" Statements
Be on the lookout for other grade level 2023 Virginia Math SOL I Can Statements coming soon!
Stay connected: Follow❤️**Candy Apple Class Aids for more.**
Mean Median Mode Notes and Activities
By Matemaths
Make teaching Mean Median and Mode easy with this super engaging digital Teacher Presentation and printable Student notes! Perfect for both In Person and Distance Learning, this resource has everything you need to give your students a solid foundation with examples and class practice exercises during the presentation.
This resource includes:
Teacher Presentation in both Google Slides and PowerPoint that provides colorful visuals illustrating concepts along with examples;
A pdf greyscale version of the presentation to be printed for students.
Copyright © 2024 Matemaths
All rights reserved by the author.
Permission to copy for single classroom use only.
Not for public display.
***YOU CAN EARN MONEY for future TeachShare purchases when you leave feedback on a resource you purchase.
All you have to do is leave feedback on the purchased resource.
In doing it, you earn TeachShare credits that credits can be redeemed and used for future purchases.
***CONTACT ME - Please feel free to contact me anytime!
Email:infomatemaths@gmail.com

6th Grade Card Matching Activities with Multiple Representations with Visuals
By MsVisualizer
Includes 4 card matching activities, saving $4.25 when purchased as a bundle.
Data Displays - matching box plots, histograms, stem and leaf plots and dot plots that represent the same data. Includes teacher questions and discussion slides
Area Formulas - matching shapes with the correct area formula with the side lengths substituted in and the answers. Includes extension & independent practice.
Properties of Operations - matching expressions using commutative, associative and distributive properties along with their corresponding visual representations.
Multiplying with Fractions/Mixed Numbers - matching multiplication problems with their corresponding visual representation to help students understand the various ways to think about and represent multiplying with fractions. Includes extension activity to help students identify when multiplying with fractions results in a product less than both factors, in between the two factors and greater than both factors.
6th Grade Statistics - Game Show Review Game
By The M-Intercept
This is the perfect way to review your 6th grade statistics unit!
Students will love this Jeopardy-like game to review the Statistics standards. This game is aligned with Common Core standards. Categories include STATISTICAL QUESTIONS, DATA DISTRIBUTION, MEASURES OF CENTER, DATA DISPLAYS, SUMAMRIZE DATA, AND VOCABULARY. Points range from 100 - 500, which reflect the increase in difficulty from 100-point basic review questions to 500-point questions that require students to apply their knowledge.
**FULLY EDITABLE** While the game is complete, it is also editable in PowerPoint, making it easy to add questions or change the level of difficulty based on your students' needs.
STATISTICAL QUESITONS: questions require students to determine whether or not a question is statistical, and identify that variability is required for statistical questions.
DATA DISTRIBUTION: questions cover finding the range, explaining the shape of the data, and the 500 point question asks students to find the mean absolute deviation (MAD).
MEAURES OF CENTER: questions involve finding mean, median, and mode from both lists of data and after looking at various data displays.
DATA DISPLAYS: questions revolve around dot plots, histograms, frequency tables, and box plots.
SUMMARIZE DATA: questions require students to draw conclusions from data, determine possible questions asked, and connect data to different situations.
**Looking for other options? **
6th Grade Review Games BUNDLE – All 6 games for the price of 5!a>
Ratios and Proportional Relationships Game Show Review
Number Systems Game Show Review
Expressions and Equations Game Show Review
Geometry Game Show Review
6th Grade All Standards Review Game – perfect for state testing and the end of the year!
7th Grade - Probability of One Event (Single independent)
By Chimp-a-roo Maths
Probability of One Event no prep lesson
- PowerPoint with examples for Teacher and Student
- Worksheet with worked solutions
- Homework sheet with worked solutions (can also be used as extra practice in a second lesson)
LICENSING TERMS: This purchase includes a license for one teacher only for personal use in their classroom. Licenses are non-transferable, meaning they cannot be passed from one teacher to another. No part of this resource is to be shared with colleagues or used by an entire grade level, school, or district without purchasing the proper number of licenses.
COPYRIGHT TERMS: This resource may not be uploaded to the internet in any form, including classroom/personal websites or network drives, unless the site is password protected and can only be accessed by students.
You may also like
Describing Events no prep lesson
6th Grade Math Bundle | Fractions Ratio Geometry Multiplication Division Algebra
By Building Bright Brains
Are you looking for a 6th Grade Math curriculum? Check out this special bundle that includes our best-selling Sixth Grade Math Units! These Sixth Grade Math Lessons are research-based and designed specifically for Sixth grade teachers and students. This Bundle includes 13 units in the series.
What is included?
✦ 13 total lessons (561 Slides)
1. Add, Subtract, Multiplying & Dividing Integers
2. Concepts In Algebra
3. Data and Statistics
4. Division whole numbers
5. Expressions and Equations
6. Fractions Multiplication and Division
7. Geometry Booklet
8. Metric Measurement Area and Volume
9. Multiplication Whole numbers and decimals
10. Number Sense, Addition, & Subtraction
11. Number Theory and Fractions
12. percentage of a number
13. Ratio, Proportion & Percent
This Bundle is great to be used for:
- In-Classroom Teaching (Displaying for the Whole Class)
- Online Learning
- Homeschooling
- Sharing on Google Classroom or Other Platforms as a Tool for Revision
-Follow us on TeachShare to be informed with new products and updates.

2023 Virginia Secondary Math SOL "I Can" Statements GROWING BUNDLE
By Candy Apple Class Aids
SAVE TIME AND ENERGY with Our 2023 Virginia Secondary Math SOL "I Can" Statements!
✨Simplify Your Teaching
Say goodbye to daily board writing! Our GROWING Bundle of "I Can" Statements makes it easy for teachers to enhance their classrooms. Available in various sizes—letter, half-sheet, and quarter-sheet—these statements come in both color and crisp black and white for easy readability.
✨Why Choose Our Bundle?
- Time-Saving: Print and post, so you can focus on teaching!
- Flexible Sizes: Fit any classroom setup with our diverse options.
- Clarity for Students: Help students understand their learning goals.
Purchase your bundle today and receive FREE updates!
✨Happy Teaching!✨
Earn TeachShare Credits: Leave a review for this product.
Mean Median Mode Notes and Activities
By Matemaths
Make teaching Mean Median and Mode easy with this super engaging digital Teacher Presentation and printable Student notes! Perfect for both In Person and Distance Learning, this resource has everything you need to give your students a solid foundation with examples and class practice exercises during the presentation.
This resource includes:
Teacher Presentation in both Google Slides and PowerPoint that provides colorful visuals illustrating concepts along with examples;
A pdf greyscale version of the presentation to be printed for students.
Copyright © 2024 Matemaths
All rights reserved by the author.
Permission to copy for single classroom use only.
Not for public display.
***YOU CAN EARN MONEY for future TeachShare purchases when you leave feedback on a resource you purchase.
All you have to do is leave feedback on the purchased resource.
In doing it, you earn TeachShare credits that credits can be redeemed and used for future purchases.
***CONTACT ME - Please feel free to contact me anytime!
Email:infomatemaths@gmail.com
Mean, Median Mode Range Skew Activity - Envelope Trading
By MsVisualizer
This is a very engaging activity that gets all students thinking and talking about the mean, median, mode, range and the shape of distributions. I use this activity the day after covering mean, median, mode, range, and skewed right/left.
Each student chooses an envelope out of 3 color choices. For example, they can choose from yellow, red, or blue envelopes.
Each "round" one piece of information is revealed and students are allowed to trade their envelopes with each other with the goal of ending up with the highest number.
The pieces of information they can choose to be revealed are the mean, median, mode, range, and shape of the distribution. As more information is revealed they have more opportunities to trade, using the information provided to determine the best color to have at the end.
Check out my Data Displays Card Match to help students make connections between dot plots, histograms, stem and leaf plots, and box plots.
6th Grade - Statistics - Mode, Median, Mean and Range no prep
By Chimp-a-roo Maths
No prep lesson for finding the mode, median, mean and range
- Power Point with an example for both an odd number of data and an even number of data
- Worksheet finding mode, median, mean, range and missing values given the mean
- Extension task to find the data given the mode, median and mean
- Answers to both exercises included
LICENSING TERMS: This purchase includes a license for one teacher only for personal use in their classroom. Licenses are non-transferable, meaning they cannot be passed from one teacher to another. No part of this resource is to be shared with colleagues or used by an entire grade level, school, or district without purchasing the proper number of licenses.
COPYRIGHT TERMS: This resource may not be uploaded to the internet in any form, including classroom/personal websites or network drives, unless the site is password protected and can only be accessed by students.
You may also like
Calculating the mean scavenger hunt
Data and Statistics | 6th Grade PowerPoint Math Lesson Slides | Circle Graphs
By Building Bright Brains
Are you teaching your students about Data and Statistics For 6th Grade? Plenty of examples and application exercises are included. You can also easily convert this to a Google Slides lesson by dragging it into your Google Drive.
What is included?
✦ 9 total slides for notes, examples and applications.
✦ All steps are animated to allow the teacher to explain them gradually.
At the end of the lesson, students will be able to
✦ Interpret Circle Graphs.
✦ Use a circle graph to complete s table.
✦ Use a circle graph to answer questions.
This resource is great for:
- In-Classroom Teaching (Displaying for the Whole Class)
- Online Learning
- Homeschooling
- Sharing on Google Classroom or Other Platforms as a Tool for Revision
-Follow us on TeachShare to be informed with new products and updates.
➵➵➵➵➵➵➵➵➵➵➵➵➵➵➵➵➵➵➵➵➵➵➵➵➵➵➵➵➵➵➵➵➵➵➵➵
More Related Products:
⤞ percentage of a number | 6th Grade PowerPoint Lesson Slides
⤞ Concepts in Algebra | 6th Grade PowerPoint Lesson Slides | Algebraic Patterns
⤞ Metric Measurement Area and Volume | 6th Grade PowerPoint Lesson Slides
⤞ Ratio Proportion & Percent | 6th Grade PowerPoint Lesson Slides
⤞ Fractions | Multiplication & Division | 6th Grade PowerPoint Lesson Slides
Data Displays Card Match 6th - Box Plots, Histograms, Stem and Leaf, & Dot Plots
By MsVisualizer
Are you tired of teaching each data display in isolation? Use this card sort to help your students see the connections between the four representations of data: box plots, histograms, stem and leaf plots and dot plots.
There are 15 sets of cards to match with 3 different displays of the same data in each match. Students will attend to the range, spread, median, mode and variability to tell which displays represent the same data sets.
Questions to prompt student thinking and discussion questions/slides are included.
Check out my Engaging Mean Median Mode Range Skew Activity
7th Grade - Probability - Complementary Events
By Chimp-a-roo Maths
Follow on lesson from finding the probability of a single outcome, here is a PowerPoint and worksheet for finding the probability of a complementary event.
High School Math Bundle | PowerPoint Lesson Slides | Derivative, Vectors, Powers
By Building Bright Brains
Are you a High school Math teacher who is looking for rigorous lessons to strengthen and supplement your explanation? This Bundle is perfect for you! It includes lessons on Equations, Derivative of Functions, Vectors, Statistics, Square Roots, Polynomials and many others!
What is included?
✦ This Bundle includes 52 PowerPoint Lesson Slides (Over 950 Slides)
1. Absolute value and intervals
2. Addition of Vectors
3. Angles in Circles using Tangents
4. Complex Numbers
5. Coordinate system
6. Counting Principle
7. Derivative of Functions and Trigonometric Functions
8. Equation of a circle
9. Equation of straight lines
10. Equations and polynomials of the second degree
11. Equations of Parallel and Perpendicular Lines
12. Exponential Functions
13. First Degree of Equations and Inequalities
14. Fractional Expressions
15. Functions and Graphing
16. Functions Limit - continuity- derivative
17. Functions limits and continuity
18. Generalities of Functions
19. Generalities of Functions part 2
20. Integration
21. Linear Functions and Proportionality
22. Linear System
23. Lines and Planes in space
24. Logarithm Functions
25. Numerical Sequence
26. Order on R- Framing and approximation
27. Orthogonality In Space
28. Parallel Lines and Planes
29. polynomial functions
30. Polynomial of One Variable
31. Polynomials
32. Powers and Radicals
33. Primitives Anti-Derivative
34. Rational & Irrational Numbers
35. Rational and Irrational Functions
36. Right Triangle Trigonometry
37. Scalar Product in Space
38. Scalar Product of Vectors
39. Sets and Cartesian product
40. Sign of The 2nd Degree Polynomials
41. Square Roots part 2
42. Statistics Part 1
43. Statistics Part 2
44. Straight Lines and Planes
45. Systems of Equations
46. Thales' Theorem
47. Trigonometric Formulas (Addition and Transformation Formulas)
48. Trigonometric Lines and Circles
49. Trigonometry (Trigonometric Equations)
50. Vector Product & vector mixed product
51. Vectors (Multiplication of a Vector by a Real Number)
52. Vectors And Systems in Space
This Bundle is great to be used for:
- In-Classroom Teaching (Displaying for the Whole Class)
- Online Learning
- Homeschooling
- Sharing on Google Classroom or Other Platforms as a Tool for Revision
-Follow us on TeachShare to be informed with new products and updates.
7th Grade - Probability - Complementary Events
By Chimp-a-roo Maths
Follow on lesson from finding the probability of a single outcome, here is a PowerPoint and worksheet for finding the probability of a complementary event.
Statistics Part 2 | High School Math PowerPoint Lesson Slides
By Building Bright Brains
Are you teaching your High School students about Statistics (Part 2)? Plenty of examples and application exercises are included. You can also easily convert this to a Google Slides lesson by dragging it into your Google Drive.
What is included?
✦ 18 total slides for notes, examples and applications.
✦ All steps are animated to allow the teacher to explain them gradually.
Throughout the Lesson, students will be introduced to the following:
✦ Statistical Vocabulary
✦ Discrete distribution
✦ Continuous distribution
✦ Calculate the mean of this distribution
✦ Determine the increasing cumulative frequency table
✦ Construct the histogram of the frequencies
✦ Construct the polygon of the increasing cumulative frequency
✦ Histogram of Frequencies
✦ Histogram of the Cumulative Frequencies
✦ Polygon of the Frequencies
✦ Graphical Representation of the Mode
✦ Graphical Calculation of the Mode
✦ Graphical Calculation of the Median
✦ Analytic Calculation of the Median
✦ Analytic Calculation of the Mode
This resource is great for:
- In-Classroom Teaching (Displaying for the Whole Class)
- Online Learning
- Homeschooling
- Sharing on Google Classroom or Other Platforms as a Tool for Revision
To check out Statistics (Part 1) click here
-Follow us on TeachShare to be informed with new products and updates.
➵➵➵➵➵➵➵➵➵➵➵➵➵➵➵➵➵➵➵➵➵➵➵➵➵➵➵➵➵➵➵➵➵➵➵➵
Other Resources:
⤞ Vectors and Systems in Space | High School Math PowerPoint Lesson Slides
⤞ Vector Product & Vector Mixed Product| High School Math PowerPoint Lesson Slides
⤞ Vectors | Multiplication of a Vector | High School Math PowerPoint Lesson Slides
⤞ Trigonometric Lines and Circles | High School Math PowerPoint Lesson Slides
⤞ Straight Lines and Planes | High School Math PowerPoint Lesson Slides
Statistics Part 1 | High School Math PowerPoint Lesson Slides
By Building Bright Brains
Are you teaching your High School students about Statistics? Plenty of examples and application exercises are included. You can also easily convert this to a Google Slides lesson by dragging it into your Google Drive.
What is included?
✦ 30 total slides for notes, examples and applications.
✦ All steps are animated to allow the teacher to explain them gradually.
Throughout the Lesson, students will be introduced to the following:
✦ Statistics Vocabulary
✦ Frequency , Relative Frequency , and Cumulative Frequency
✦ Graphical Representation (Bar Chart, Frequency Polygon, Circular Diagram “Pie chart”)
✦ Measures of Central Tendency (Mode, Mean, Median)
✦ Measures of Dispersion (Range, Mean Deviation, Variance, & Standard Deviation)
This resource is great for:
- In-Classroom Teaching (Displaying for the Whole Class)
- Online Learning
- Homeschooling
- Sharing on Google Classroom or Other Platforms as a Tool for Revision
To check out Statistics (Part 2) click here
-Follow us on TeachShare to be informed with new products and updates.
➵➵➵➵➵➵➵➵➵➵➵➵➵➵➵➵➵➵➵➵➵➵➵➵➵➵➵➵➵➵➵➵➵➵➵➵
Other Resources:
⤞ Vectors and Systems in Space | High School Math PowerPoint Lesson Slides
⤞ Vector Product & Vector Mixed Product| High School Math PowerPoint Lesson Slides
⤞ Vectors | Multiplication of a Vector | High School Math PowerPoint Lesson Slides
⤞ Trigonometric Lines and Circles | High School Math PowerPoint Lesson Slides
⤞ Straight Lines and Planes | High School Math PowerPoint Lesson Slides